I’m Sharon, a senior product designer. I build design systems and the product experiences that run on them. I like finding the simplest way to solve a problem through design, and proving it works with real results.
Selected work
Let’s talk.
Open to senior product design roles. Based in Tel Aviv, working in English, Hebrew and Spanish.
I’m Sharon, a senior product designer. I build design systems and the product experiences that run on them.
Selected work
Let’s talk.
Open to senior product design roles. Based in Tel Aviv, working in English, Hebrew and Spanish.
Design System: Color Architecture
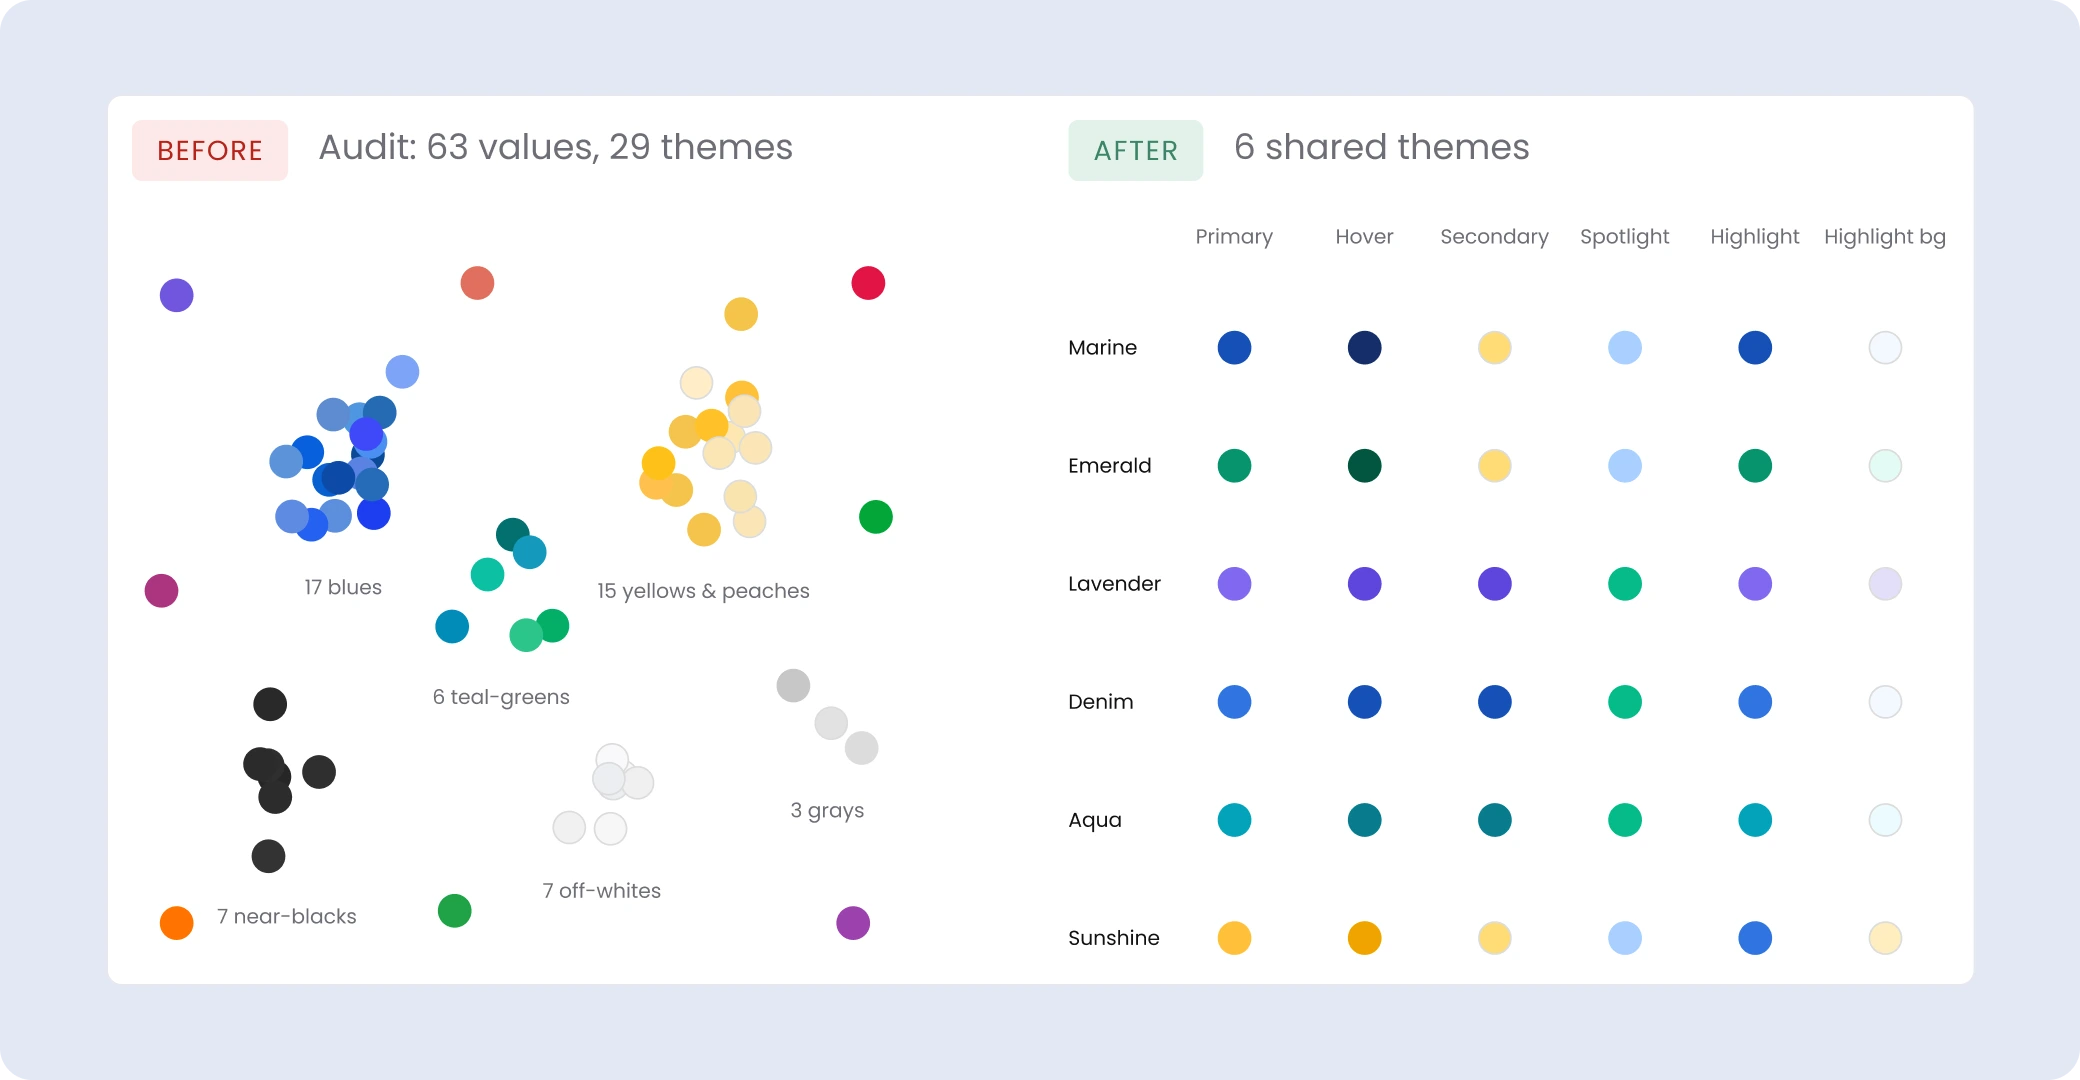
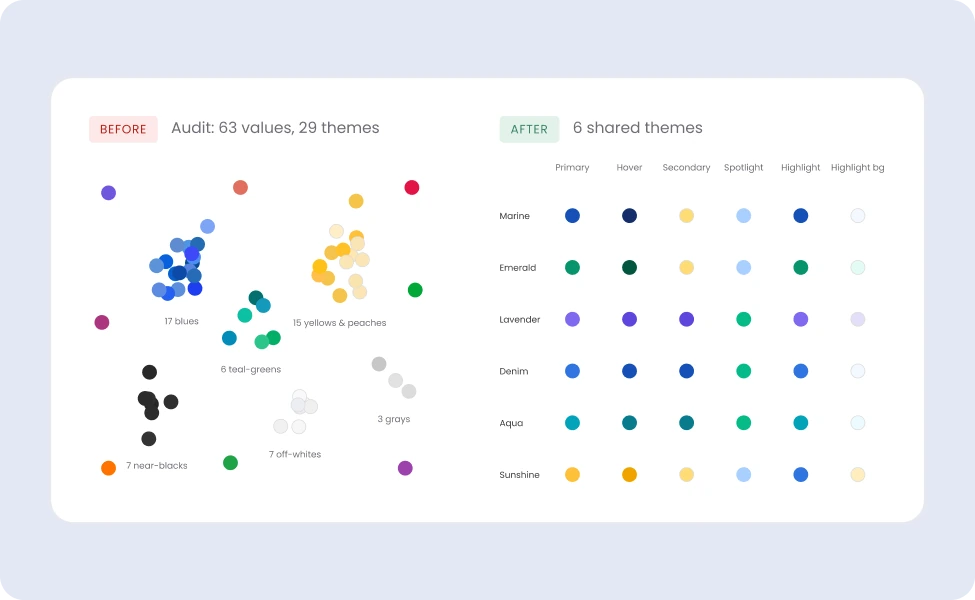
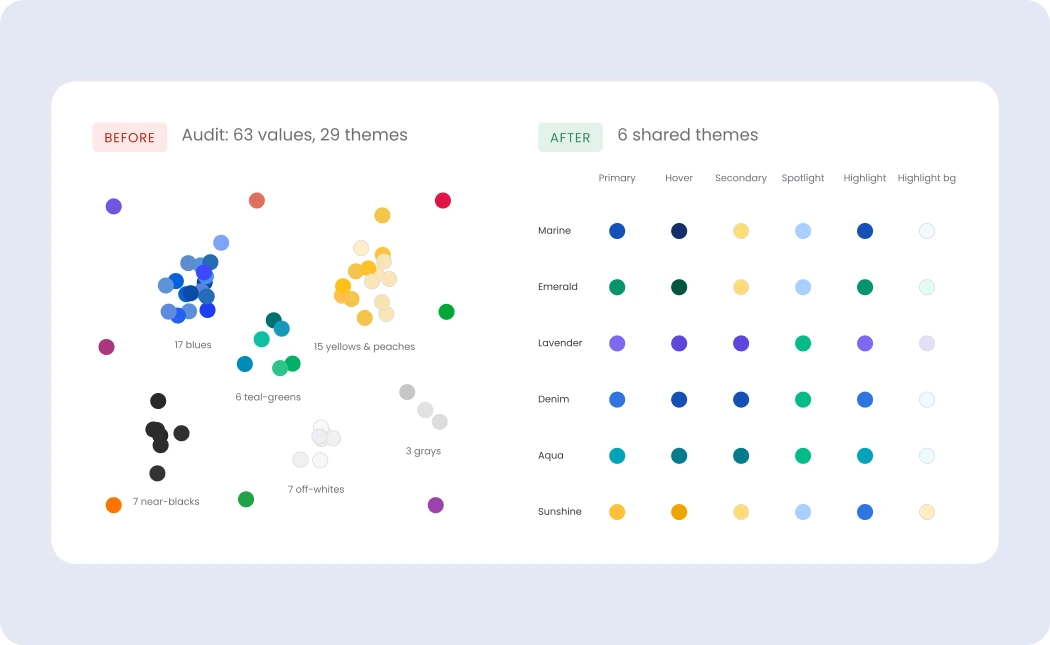
Cappsool and Better Impression, two comparison-site companies acquired by Natural Intelligence, built the same kind of product separately. I led the creation of one shared design system for both, cutting duplicated work while keeping each brand’s identity and years of A/B-tested design.
Result: One system now serves both companies. Themes ship and A/B test faster, with 72% fewer color tokens and 6 shared themes instead of 29.
COMPANY
Natural Intelligence
TIMEFRAME
9 months · Aug 2024
ROLE
Lead Product Designer
TEAM
2 designers · 2 developers
The problem
Repeated color palettes
Overlapping hue families, defined separately. Two sources of truth that drifted apart.

Inconsistent color names
Colors were named by mood (“calm”, “calmer”) instead of a scale (“Blue 300”), so the names didn’t show how colors related.
calmer
→
Blue 300
Duplicated design & code
21 verticals across 2 companies, each on its own platform and its own design system. The same features were built from scratch in both.
Cappsool DS
Better Impression DS
Business impact
Slower delivery: 47% of colors were hard-coded, so theme changes meant editing each vertical by hand.
main challenge
Unify both systems under one token structure, without visible changes or losing the details that had already won A/B tests.
Ownership
I led
Color system
Audit
Token architecture
Accessibility decisions
Rating decisions
Aligning product and engineering
I built
Tokens and components
Tokens: corner radius
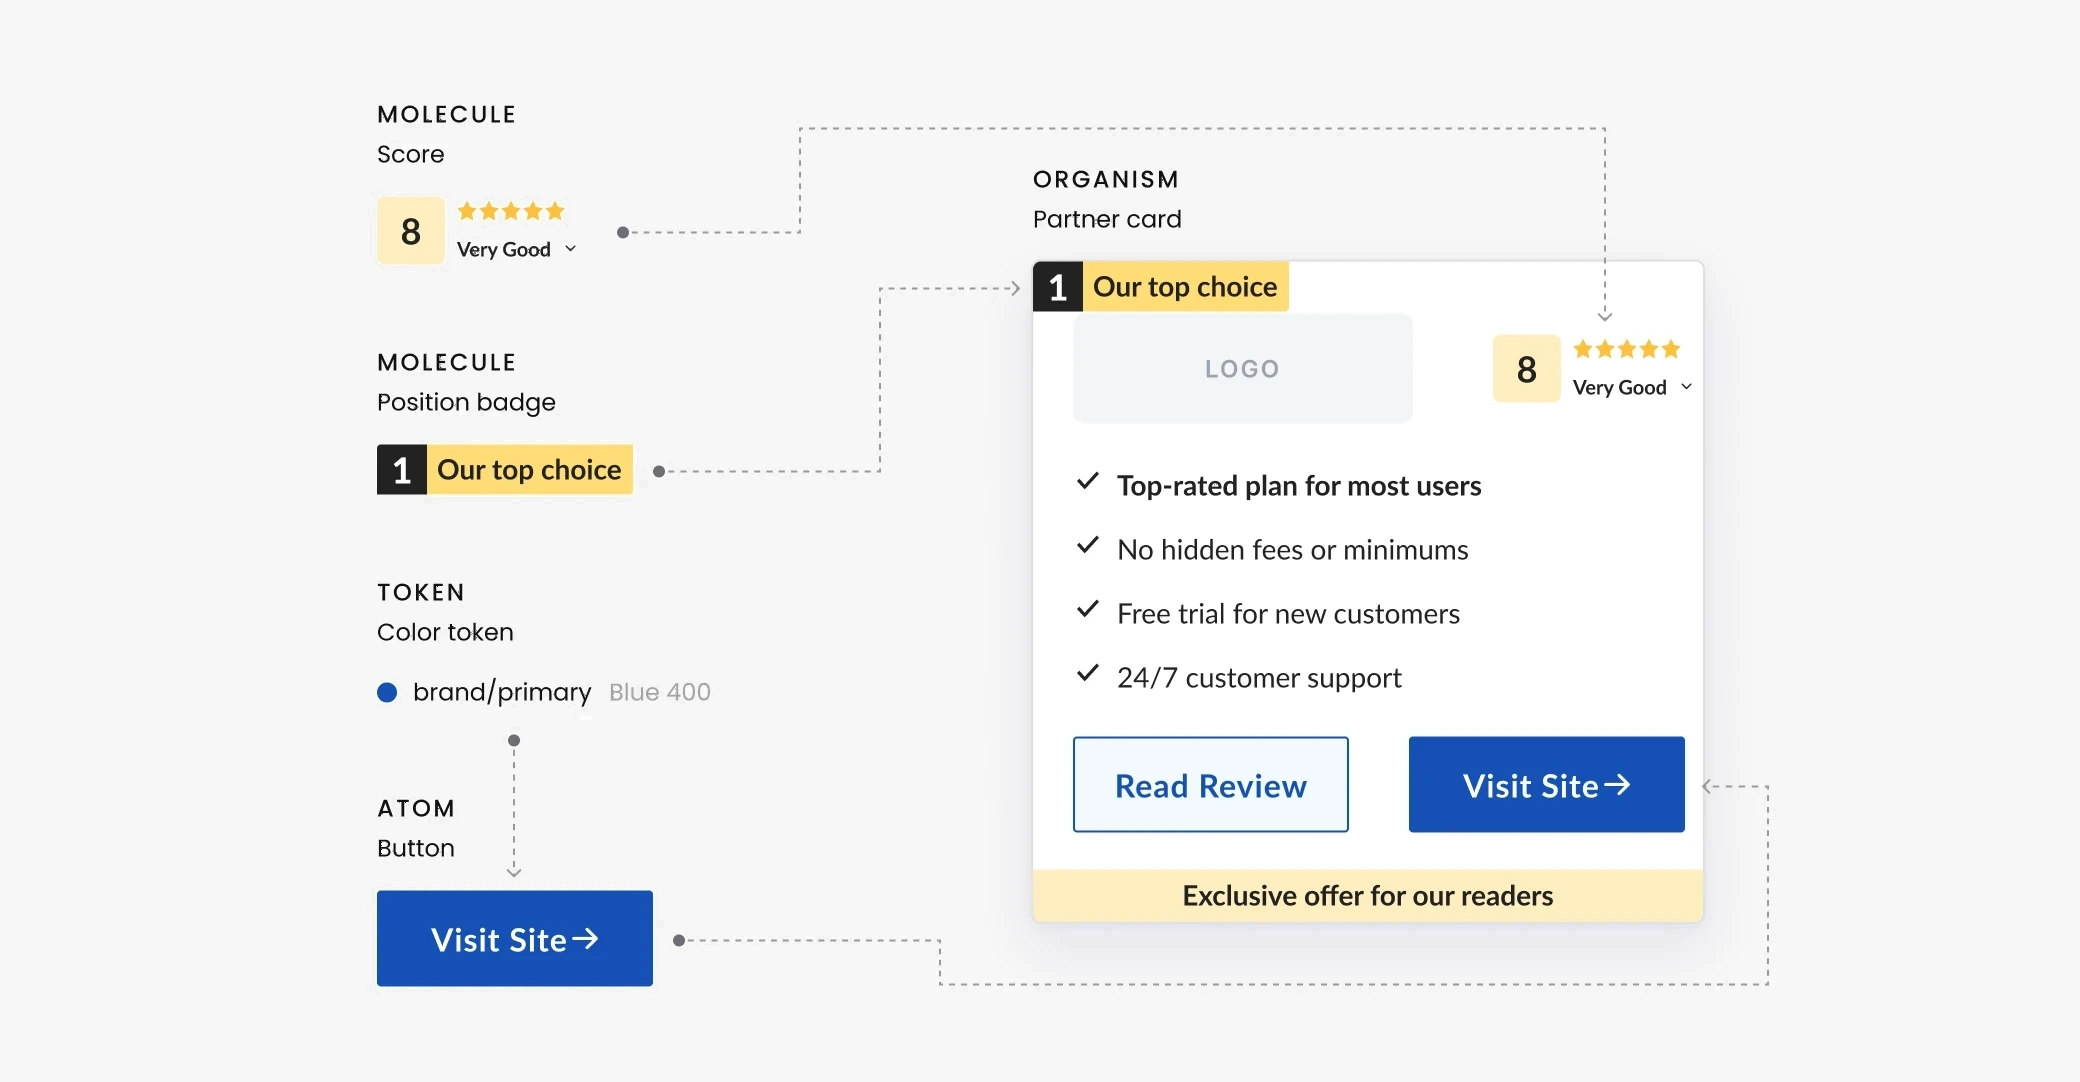
Atoms: icons, buttons, navigation
Molecules: badges, score
Organisms: partner cards
Documentation and design QA
Second designer
Foundation tokens
Shadows
Typography
Spacing

How the pieces I built fit together

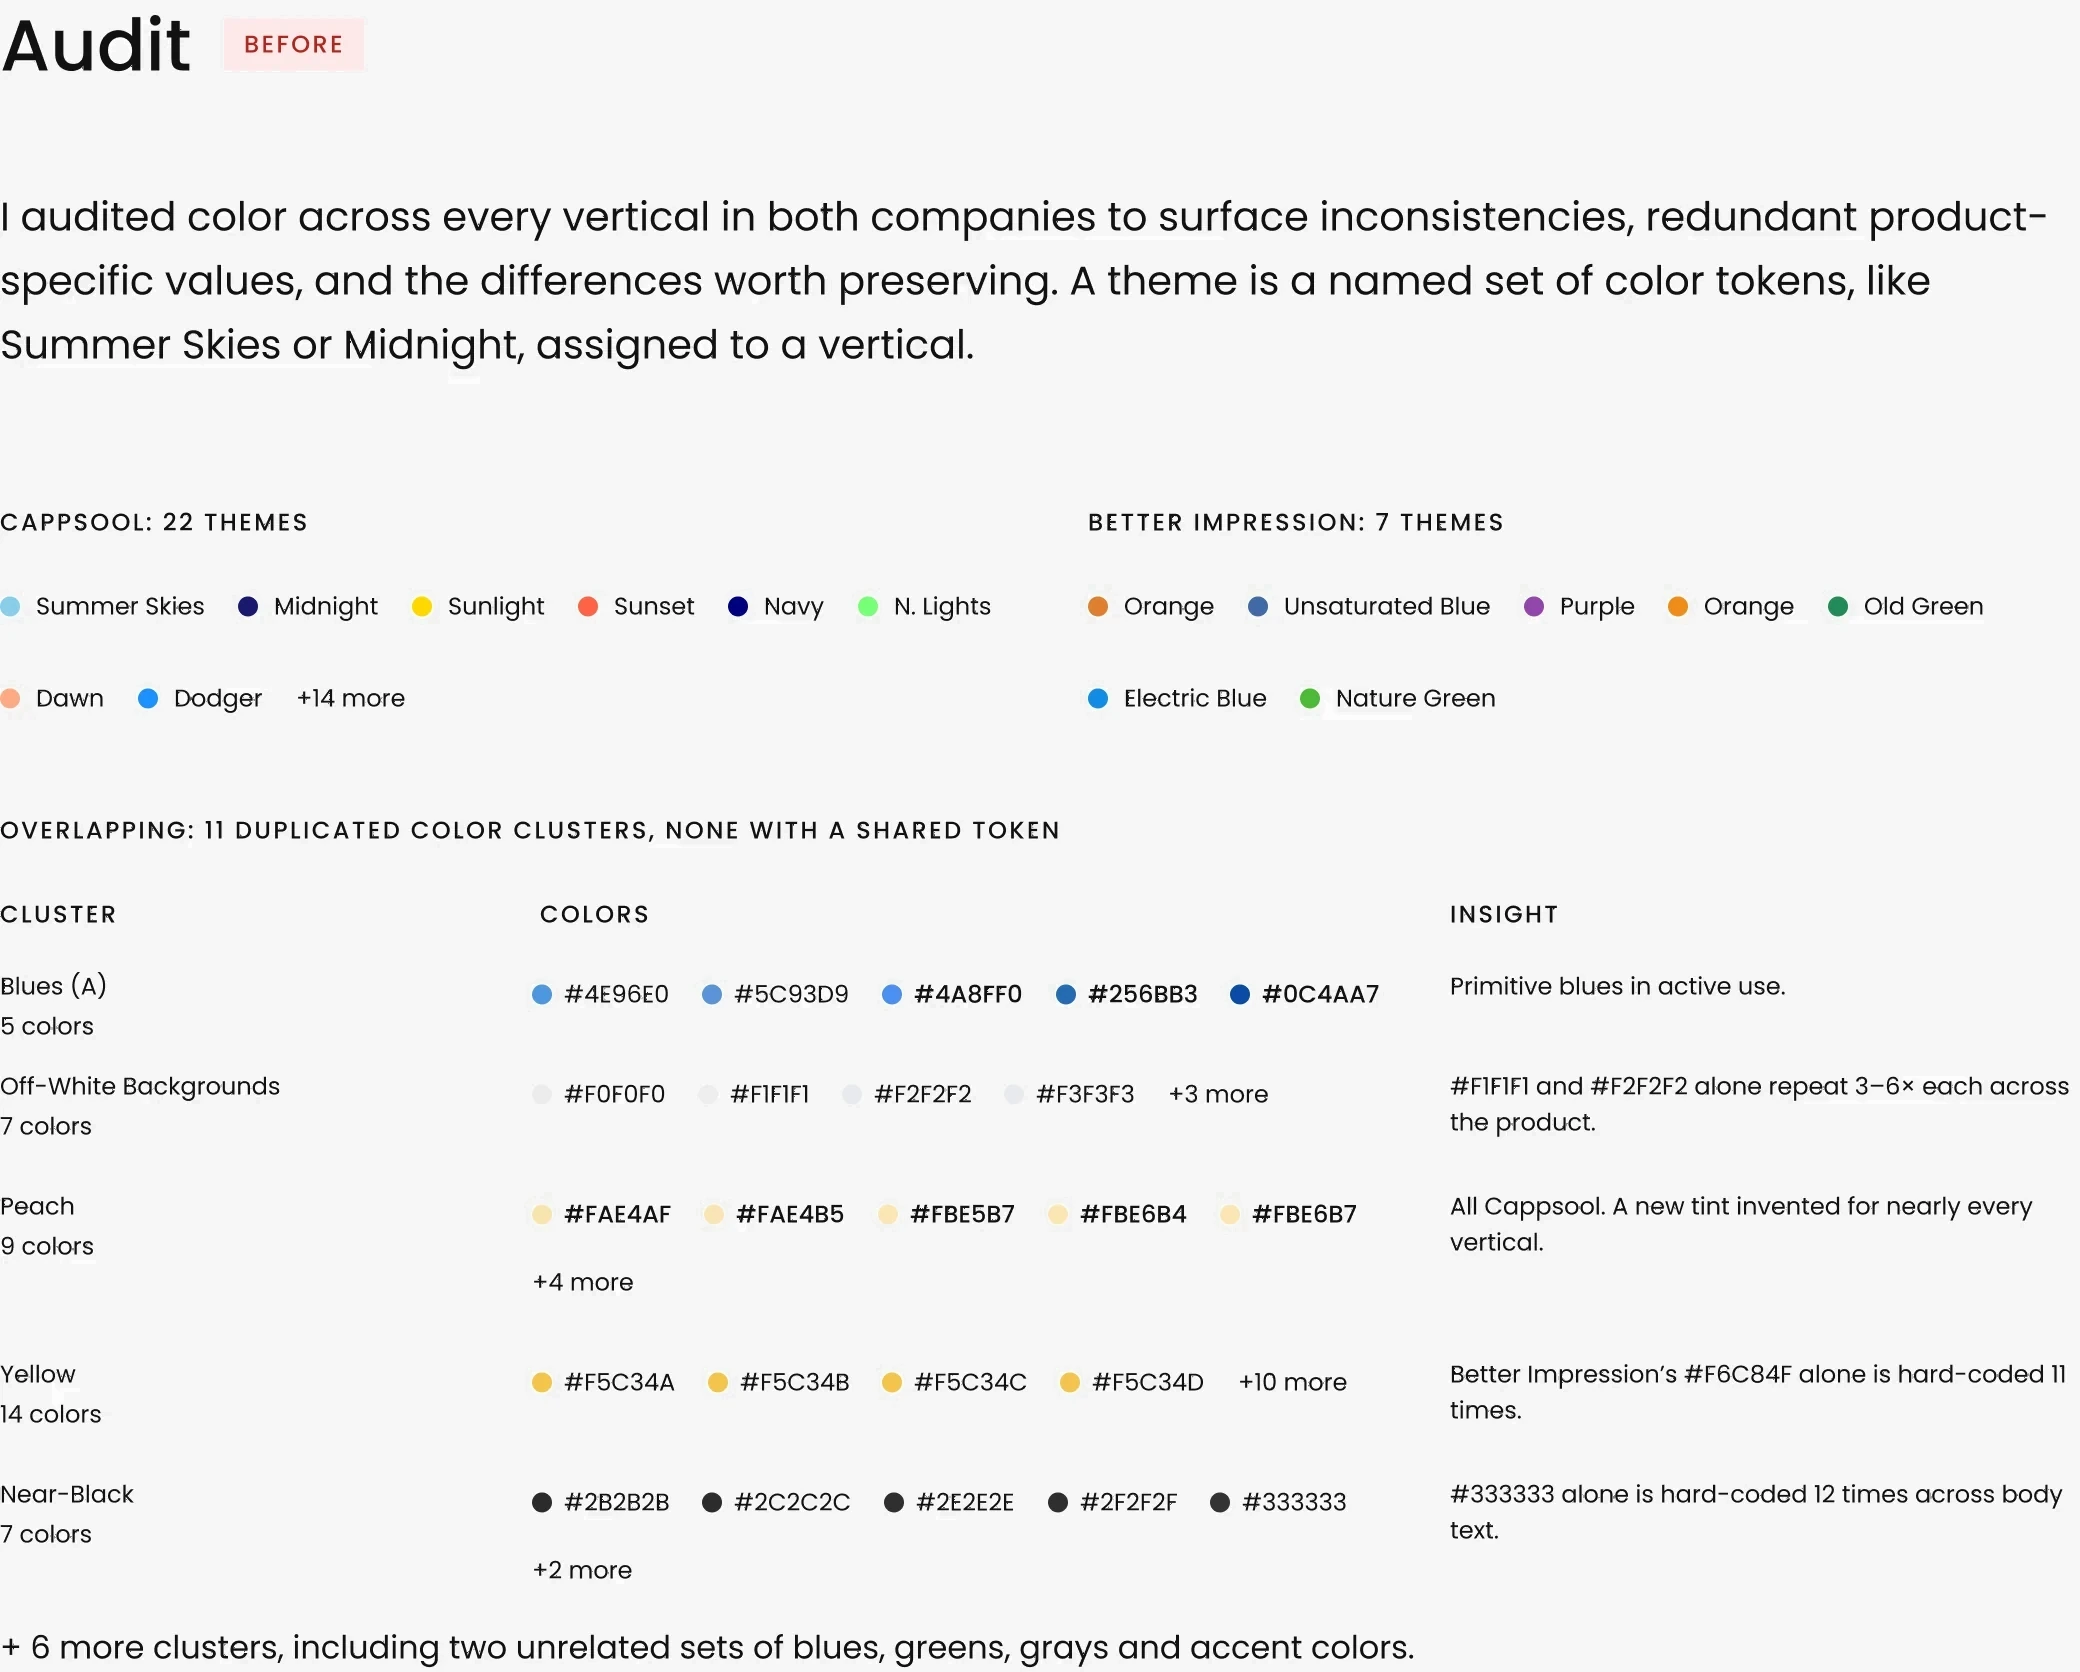
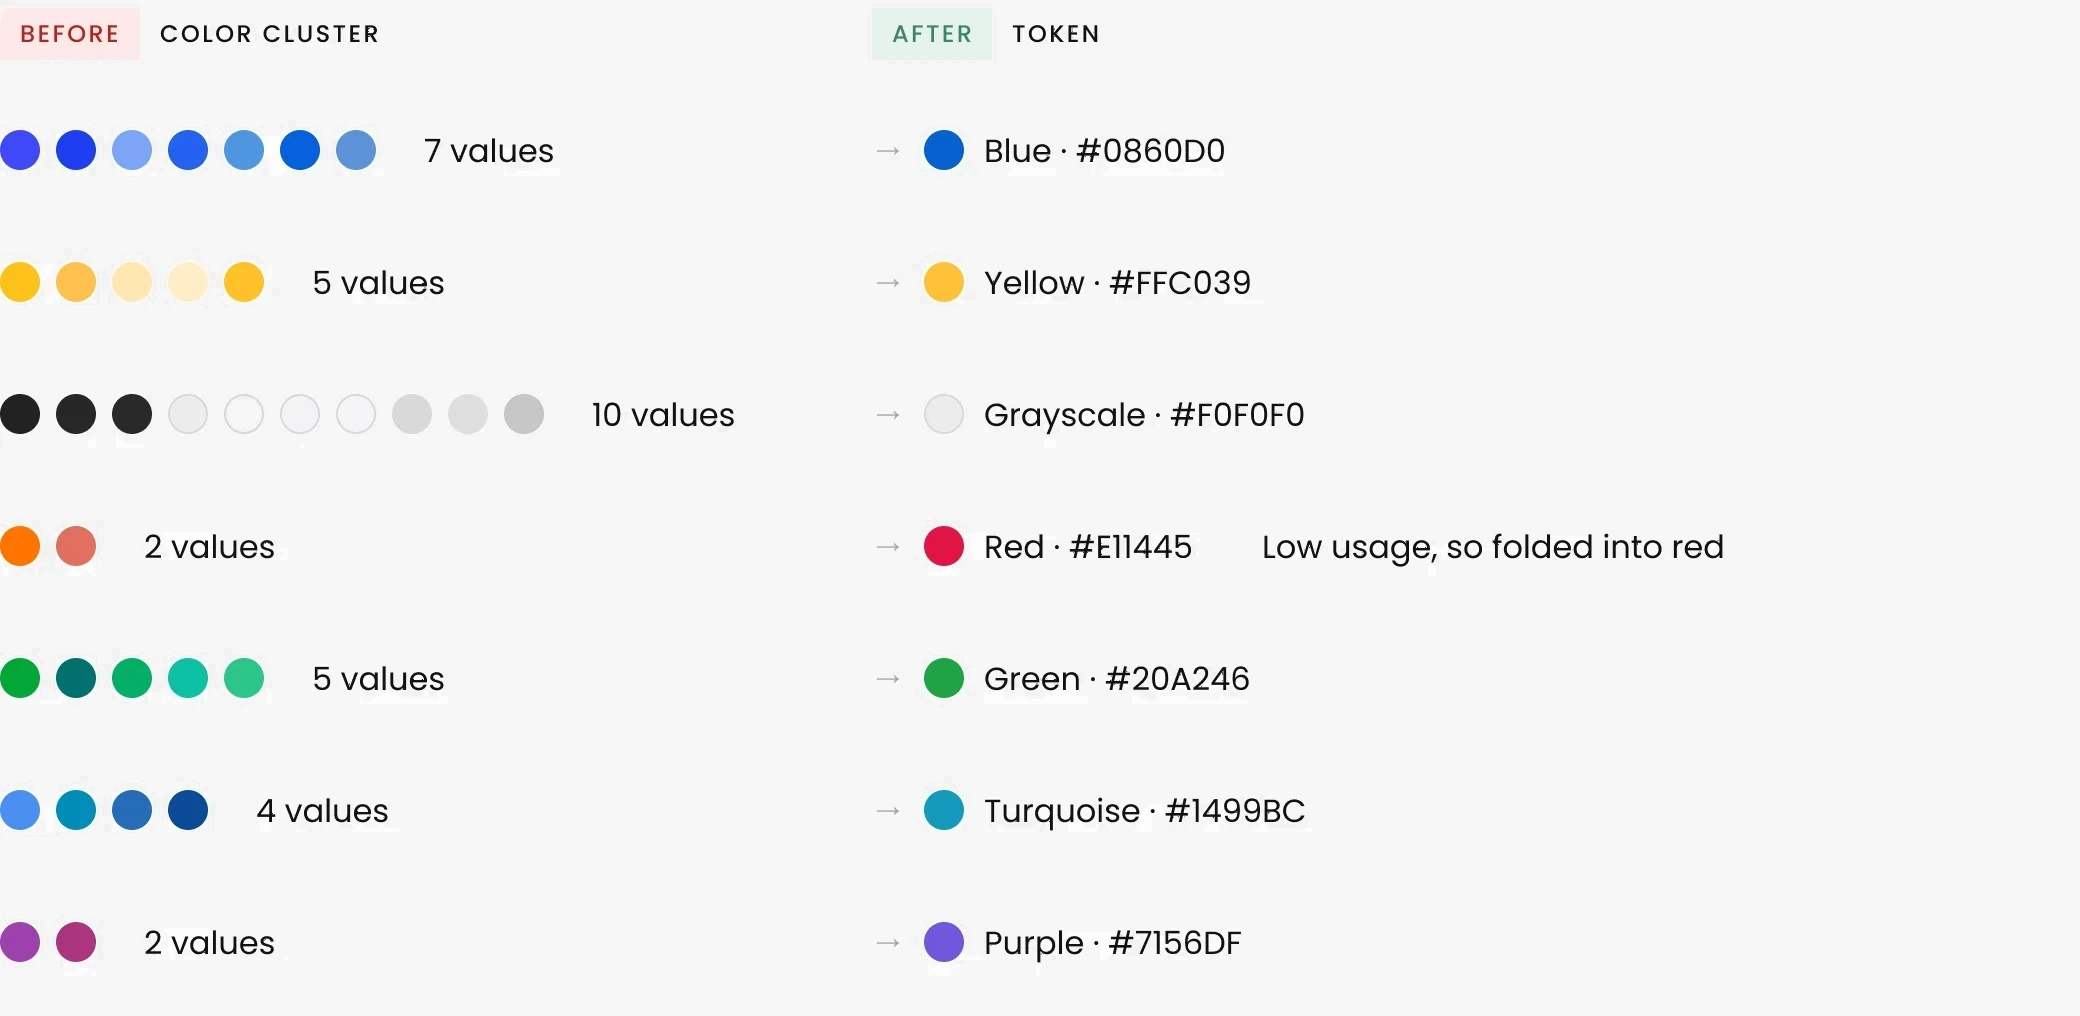
Consolidation
35 colors consolidated into 7 base tones. Each one seeds a full scale (100, 200, 300…) of primitive tokens.
Architecture
Primitives → semantic tokens → system tokens. Themes can be swapped without touching any component.
Primitive Tokens
FAMILY
SCALE
Blue
Blue 100
Blue 200
Blue 300
Blue 400
Blue 500
Purple
Purple 100
Purple 200
Purple 300
Purple 400
Purple 500
Green
Green 100
Green 200
Green 300
Green 400
Green 500
Turquoise
Turquoise 100
Turquoise 200
Turquoise 300
Turquoise 400
Turquoise 500
Yellow
Yellow 100
Yellow 200
Yellow 300
Yellow 400
Yellow 500
Red
Red 100
Red 200
Red 300
Red 400
Red 500
Grayscale
Grayscale 100
Grayscale 400
Grayscale 500
Grayscale 600
Grayscale 800
Grayscale 900
Grayscale 1000
Semantic Tokens
The partner card is the core conversion component across all verticals.
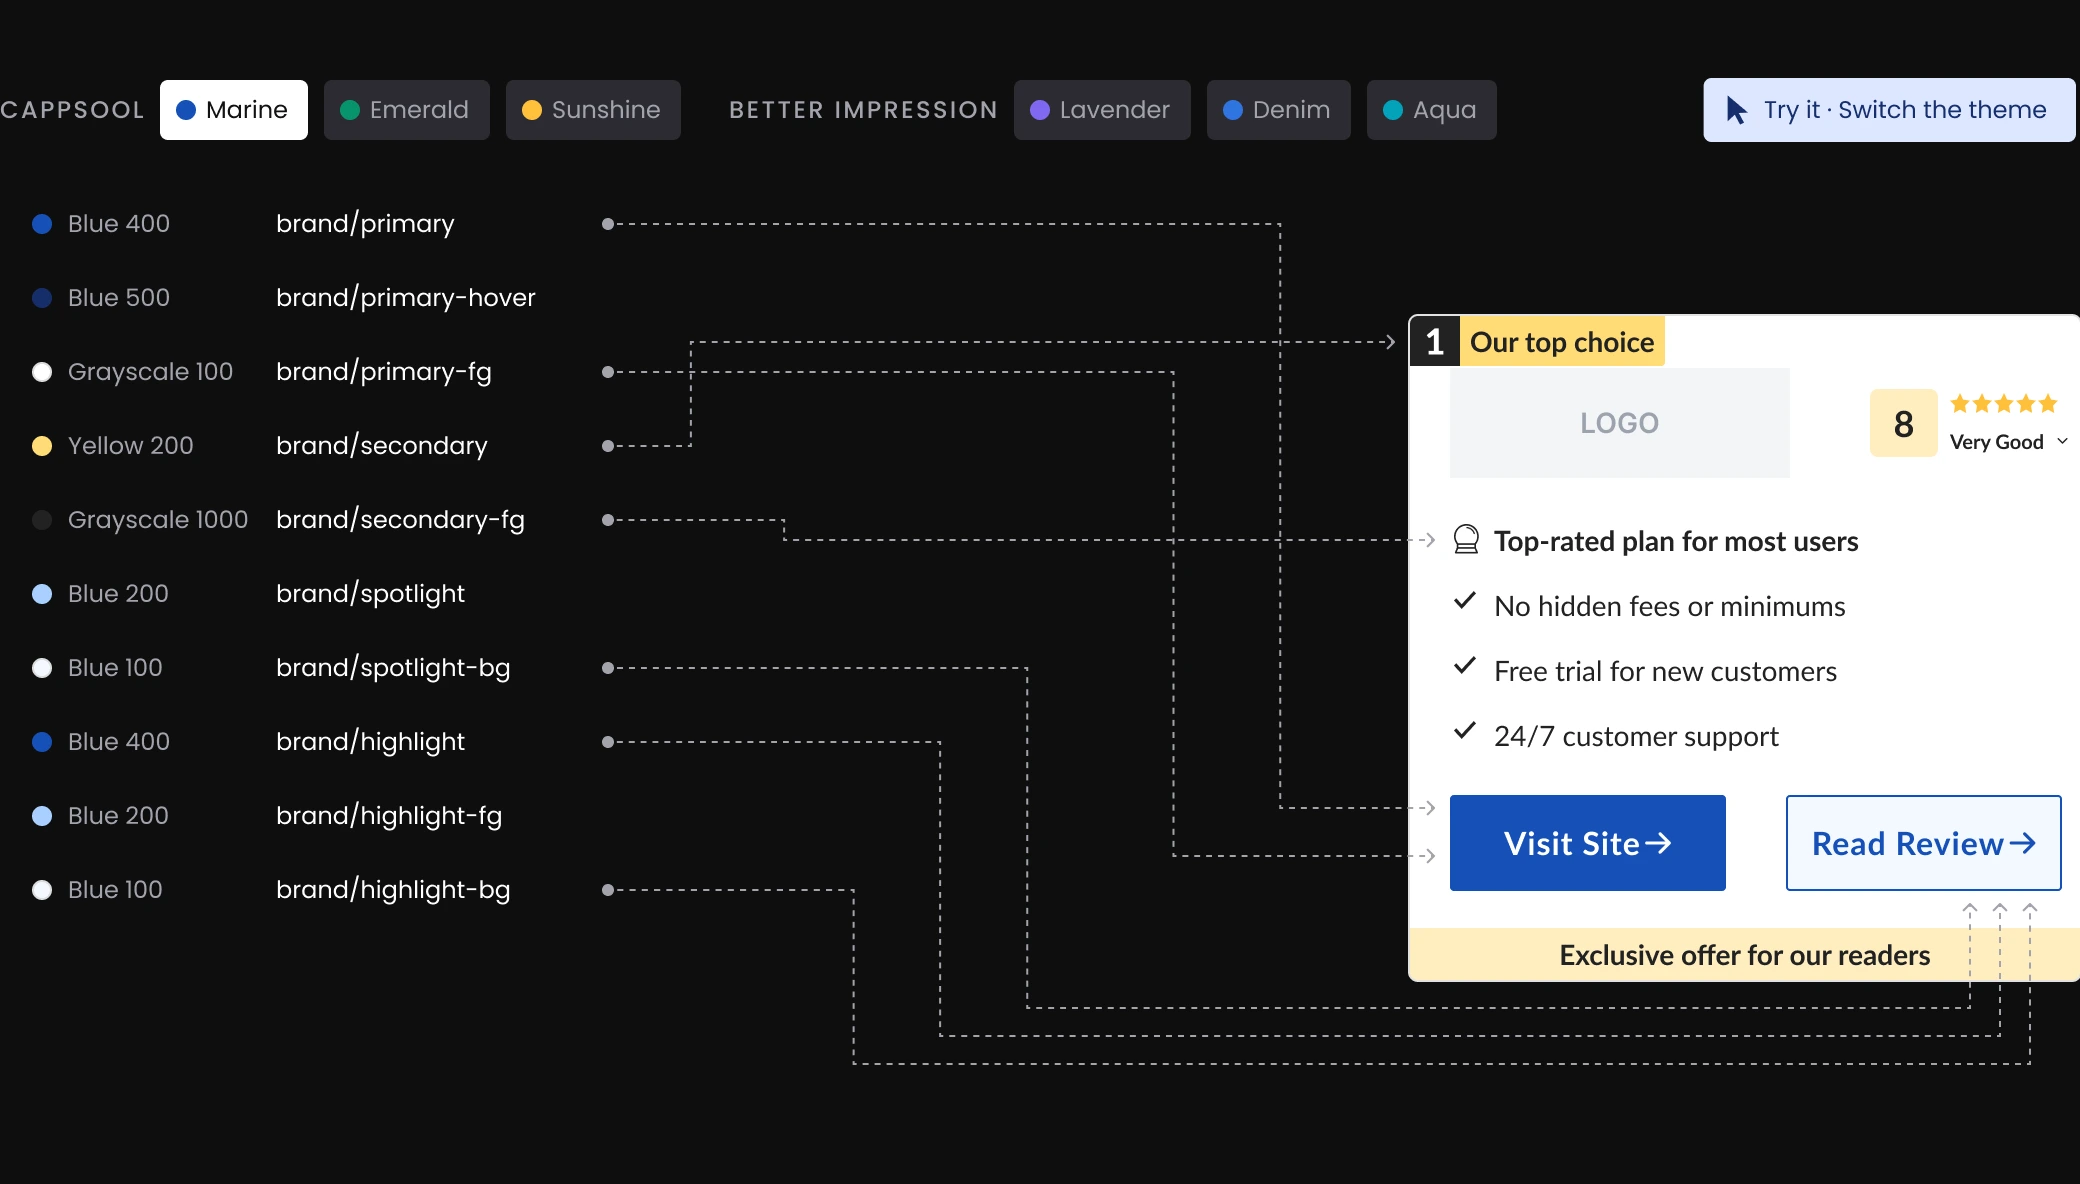
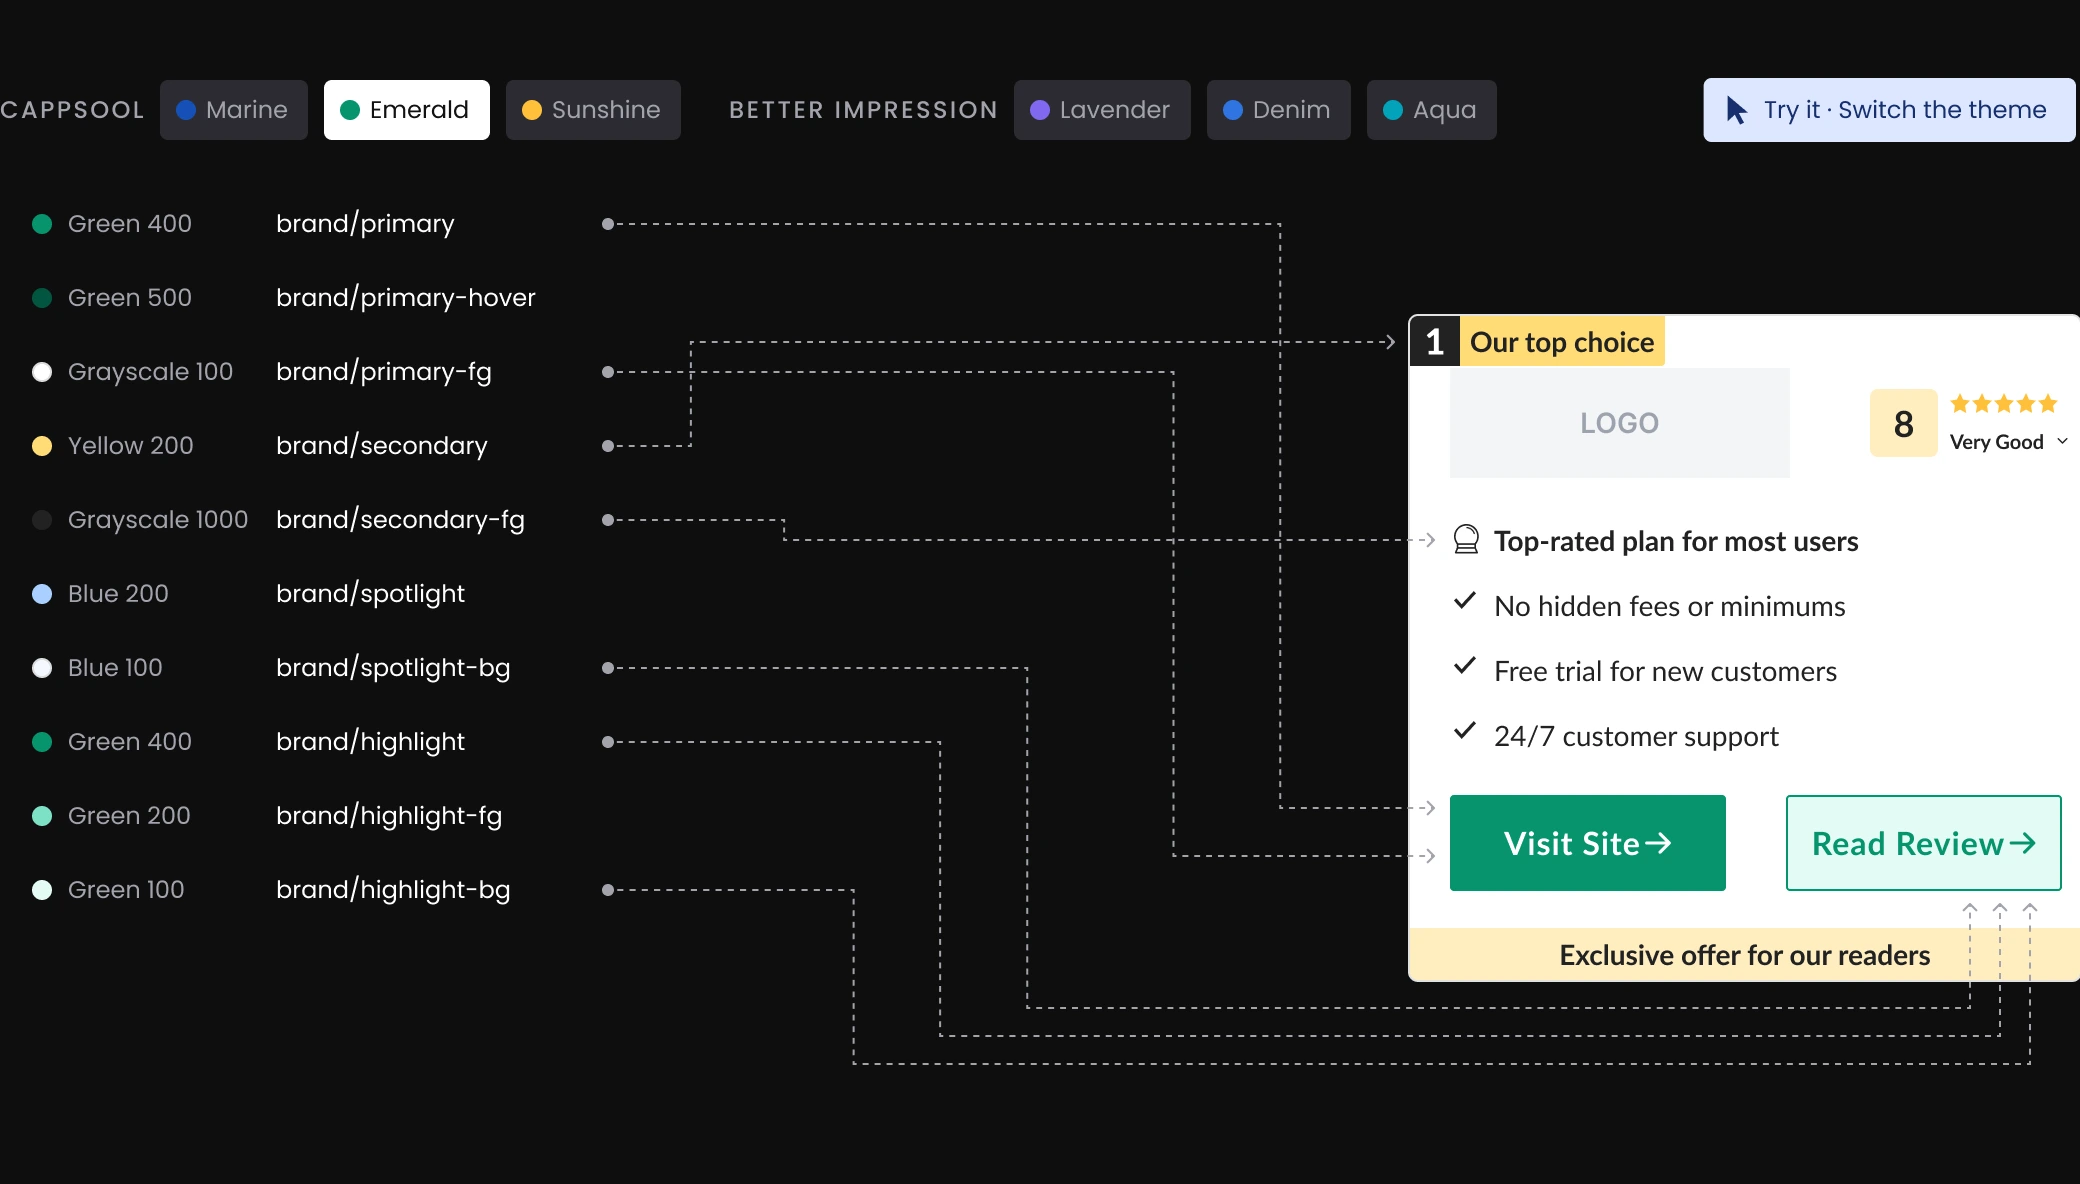
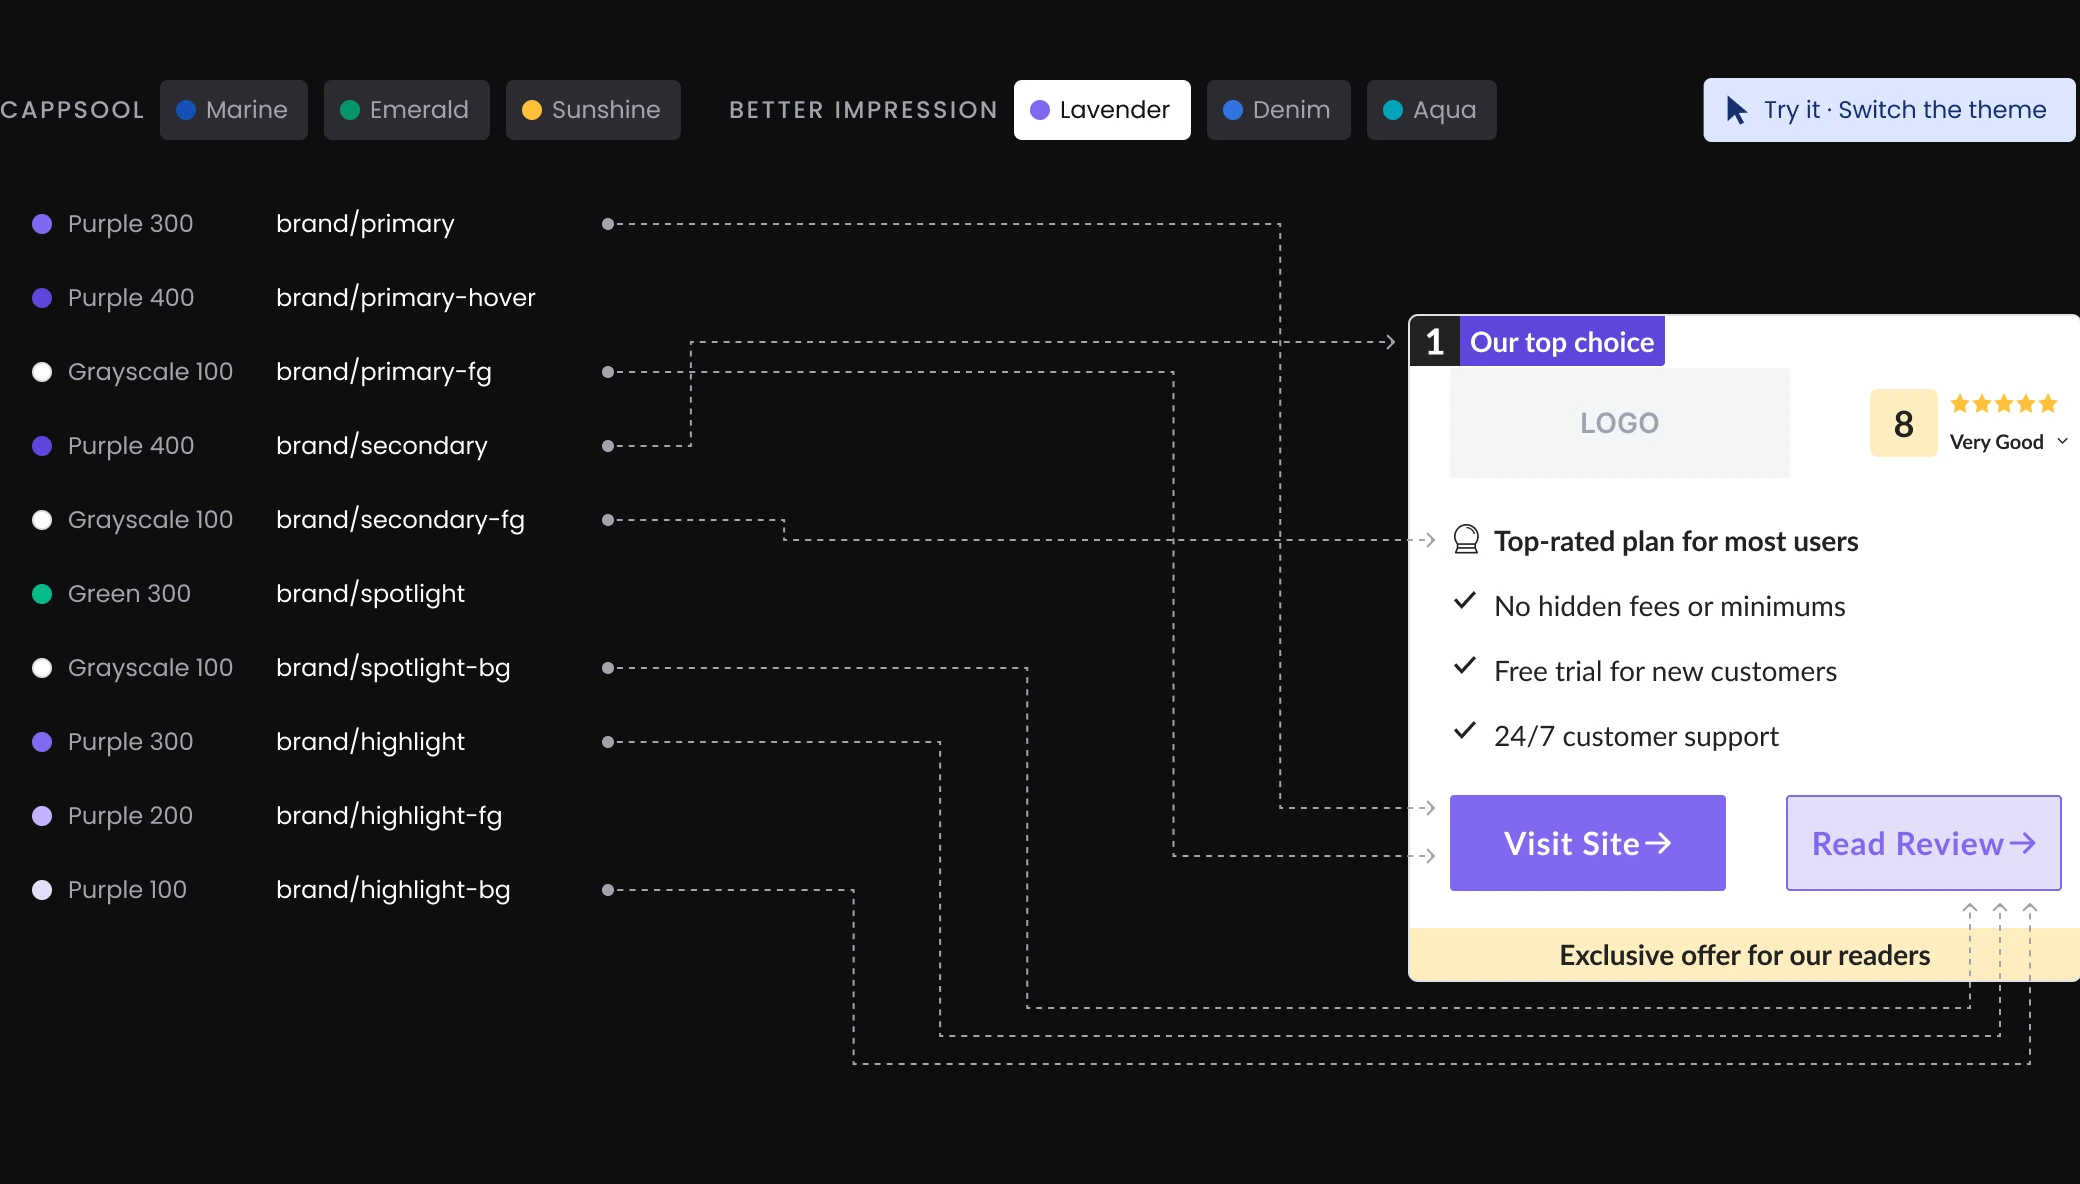
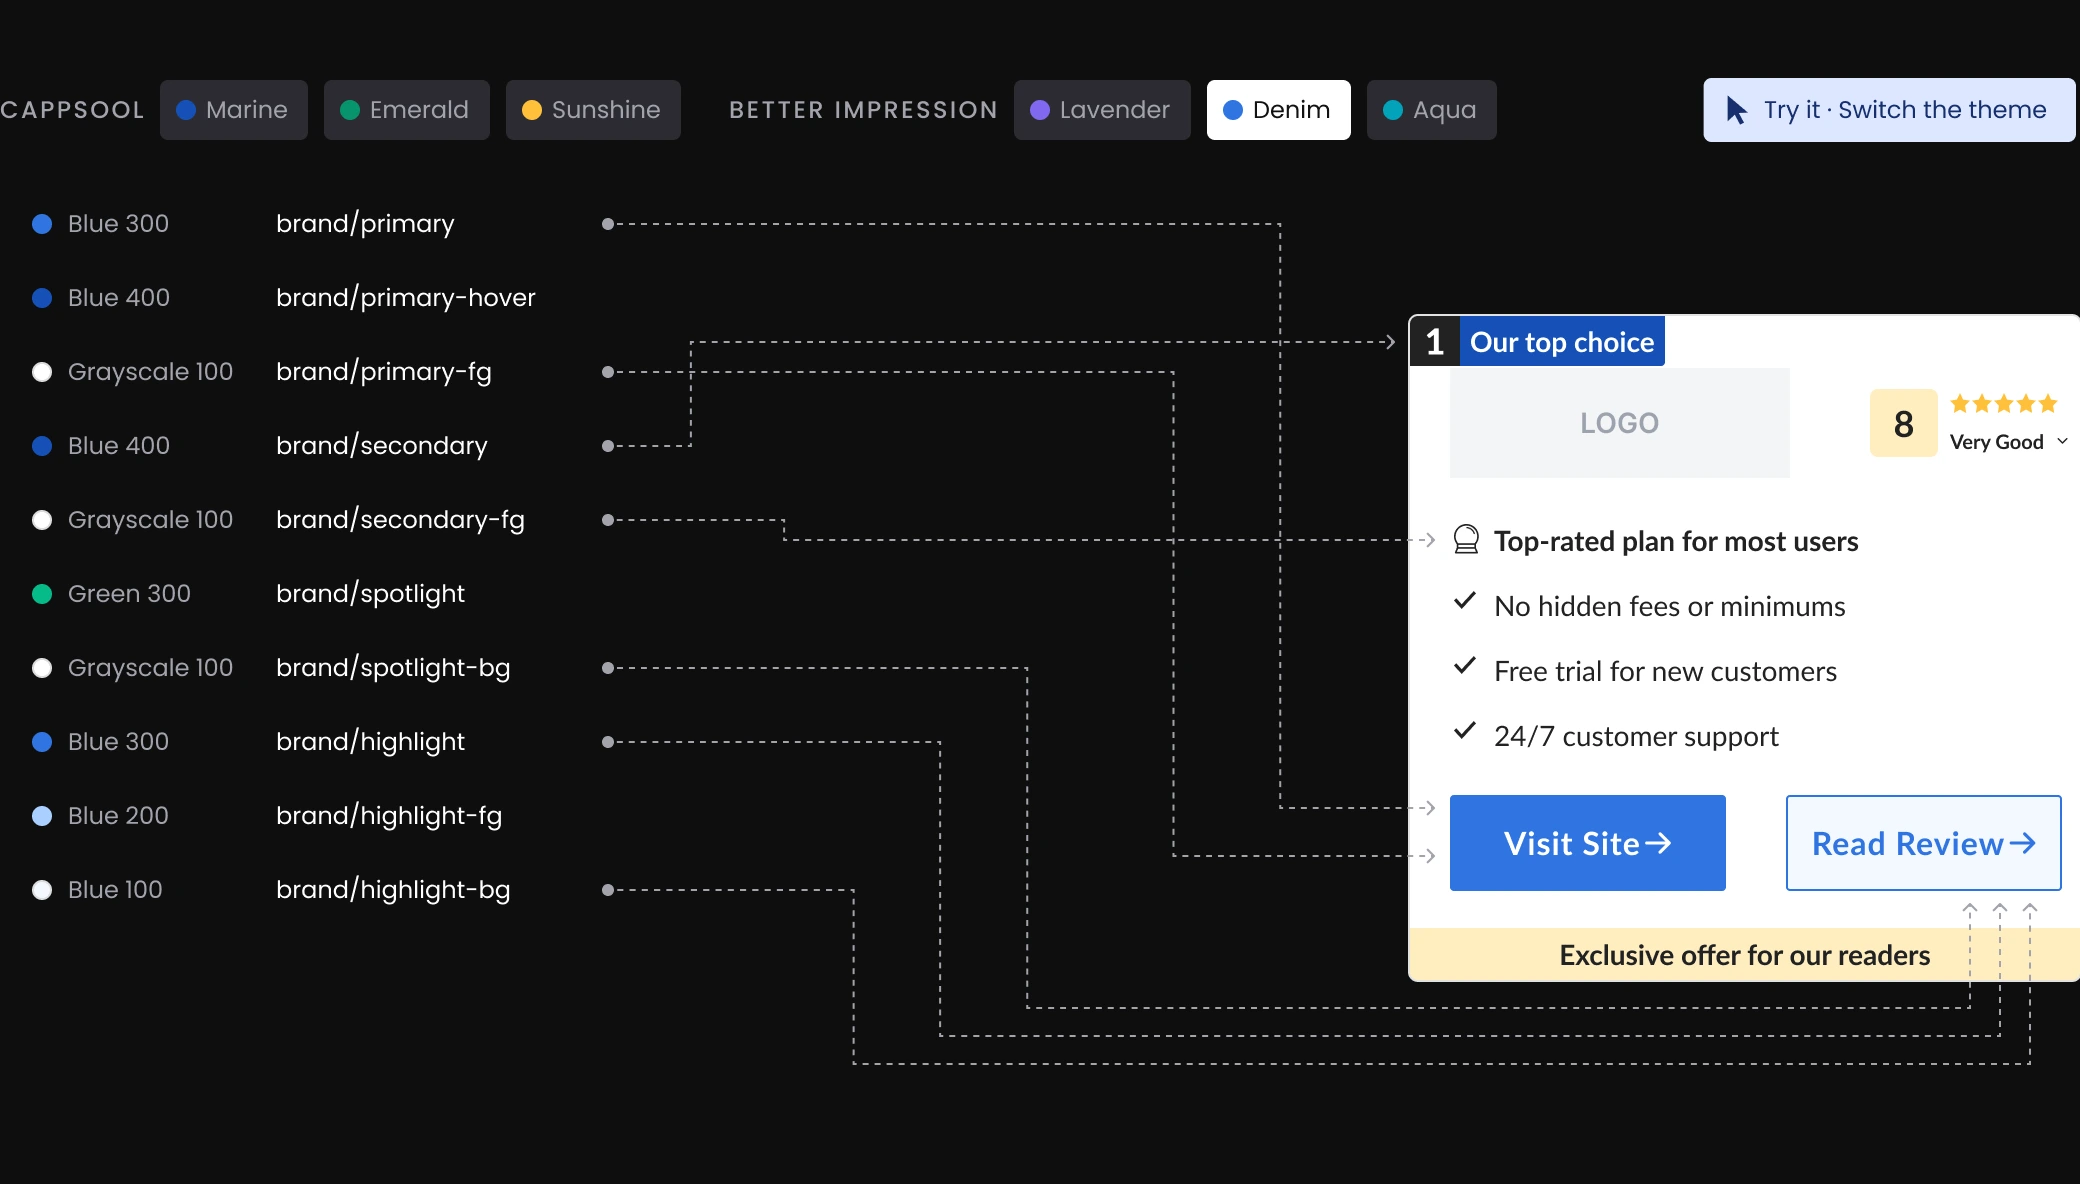
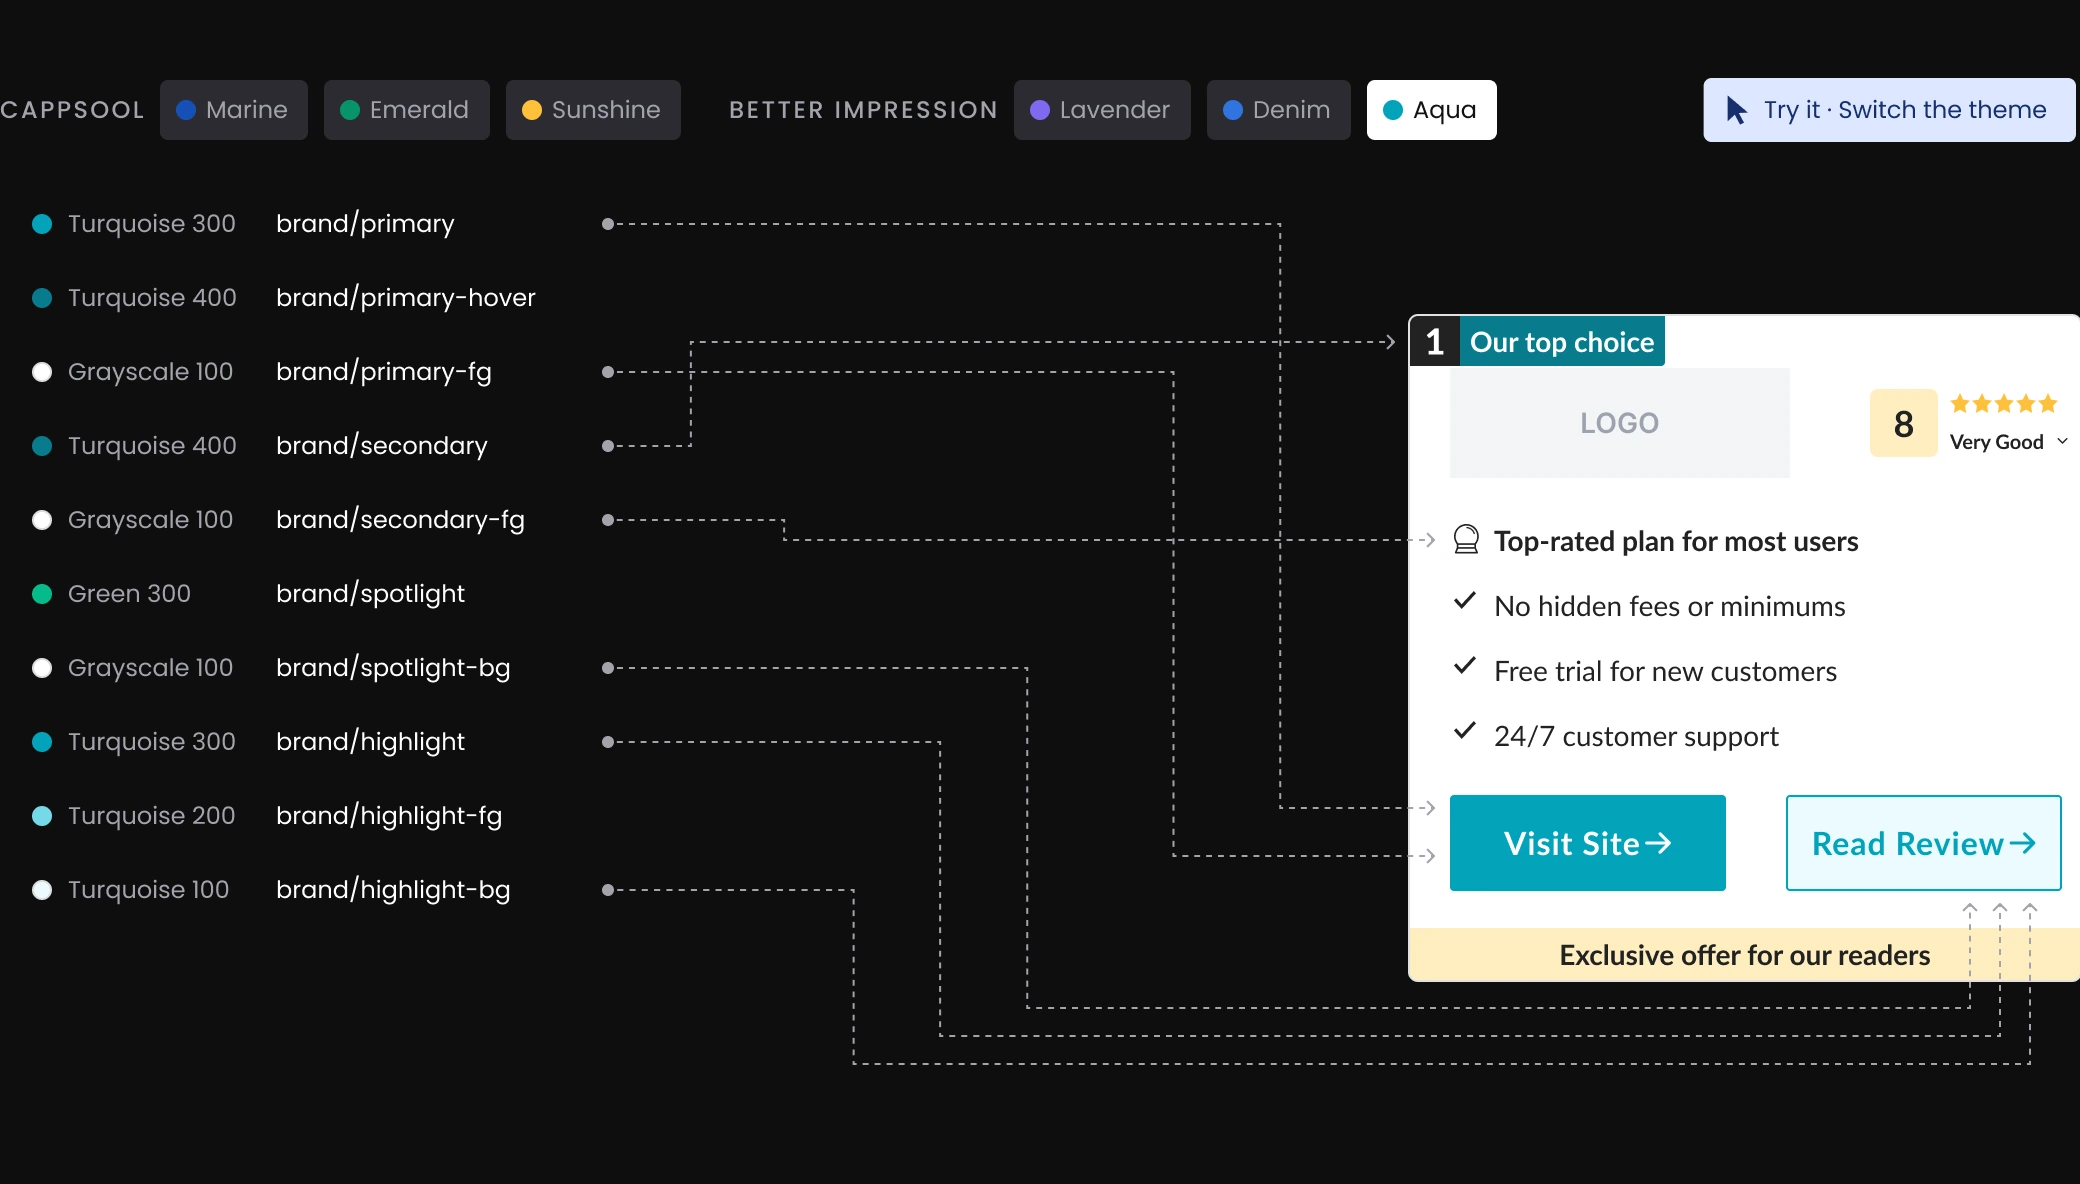
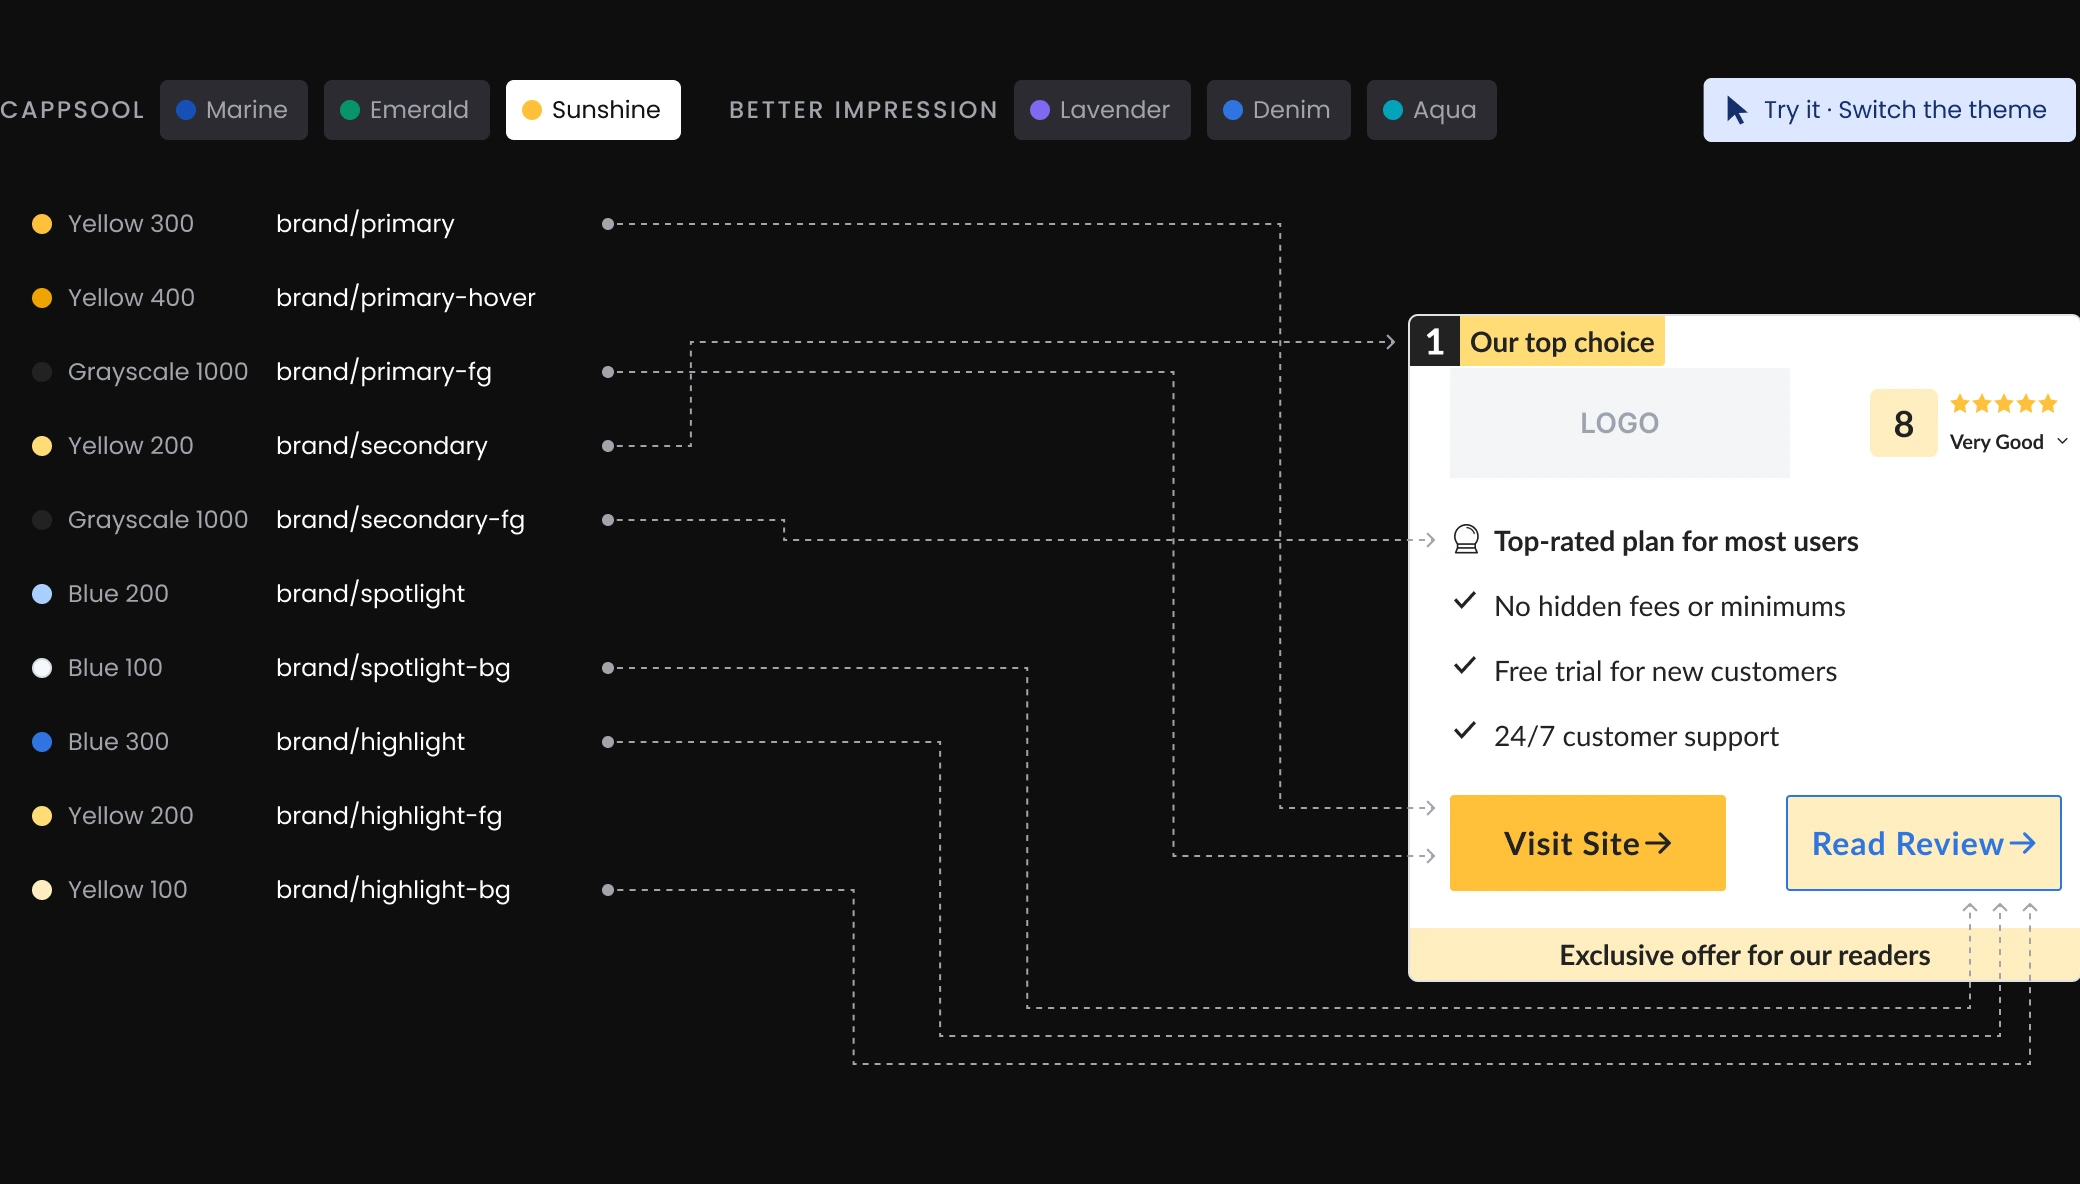
Either company can use any theme, as long as the two never use the same theme on the same vertical.
System Tokens
CATEGORY
TOKEN
LIGHT
DARK
Foreground
FG-10
Grayscale 1000
Grayscale 100
FG-20
Grayscale 600
Grayscale 400
FG-30
Grayscale 100
Grayscale 100
Borders
Border-10
Grayscale 400
Grayscale 900
Border-20
Grayscale 500
Grayscale 800
Intent
negative
Red 400
Red 300
positive
Green 300
Green 300
positive-hover
Green 500
Green 400
info
Blue 300
Blue 200
Disabled
disabled
Grayscale 500
Grayscale 600
Tracing one color through the layers
Raw value
#1650b7

↓
Primitive token (Layer 01)
Blue 400
#1650b7
↓
Semantic token (Layer 02, Marine)
brand/primary
#1650b7
↓
Applied
Label
From Figma to code
I built the Figma variables and tokens, with one naming convention for designers and developers from day one, and shared them as the single source. An external design-system consultancy guided the structure and stayed on call for support. Today anyone on the design team builds with it.
Decision: ratings
I owned the decision on how to differentiate the two companies’ ratings.
SEO risk
It had happened before: Google flagged near-identical pages as duplicate content.
vs
Proven performance
Those colors had already won A/B tests. Replacing them meant re-testing from scratch.
How I got there
The problem
Both companies used the same rating colors.
Cappsool

Golden
Better Impression
Golden
✕
Pages looked like duplicates
Iteration 1: What I tried
Rating colors as tokens inside each company’s theme.
Marine theme
Golden, locked
Lavender theme

Forest, locked
✕
Changing the rating meant changing the theme
Iteration 2: My decision
Two swappable rating systems, Golden and Forest.
Built from the same validated colors, so nothing had to be re-tested.
CHOSEN
Marine theme
Golden
Marine theme
Forest
✓
Any theme, either rating
Outcome
Golden started as Cappsool’s rating and Forest as Better Impression’s. Now no theme owns a rating color.
Decision: contrast
With no one owning the shared outcome, conflicts between the two teams stalled. The position badge is one example.
Product
Focused on business results. Protected proven theme details.
vs
Engineering
Focused on delivery speed. Wanted one shared system with no per-theme exceptions.
How I got there
The problem
One shared white foreground on every theme.
Marine

secondary
primary-fg
Lavender

secondary
primary-fg
✕
White text unreadable
Iteration 1: What I tried
Darken the yellow so white text stays readable.
Marine

secondary → #F8B700
primary-fg
Lavender

secondary
primary-fg
✕
Readable, but the proven color changed
Iteration 2: My decision
Original yellow, with its own foreground token.
CHOSEN
Marine

secondary
secondary-fg (new)
Lavender
secondary
secondary-fg (new)
✓
Original color, readable text
Outcome
6/6 themes pass AA, 0 component changes.
Validation
Engineering migrated both companies to one platform, one vertical at a time.
How each theme was tested
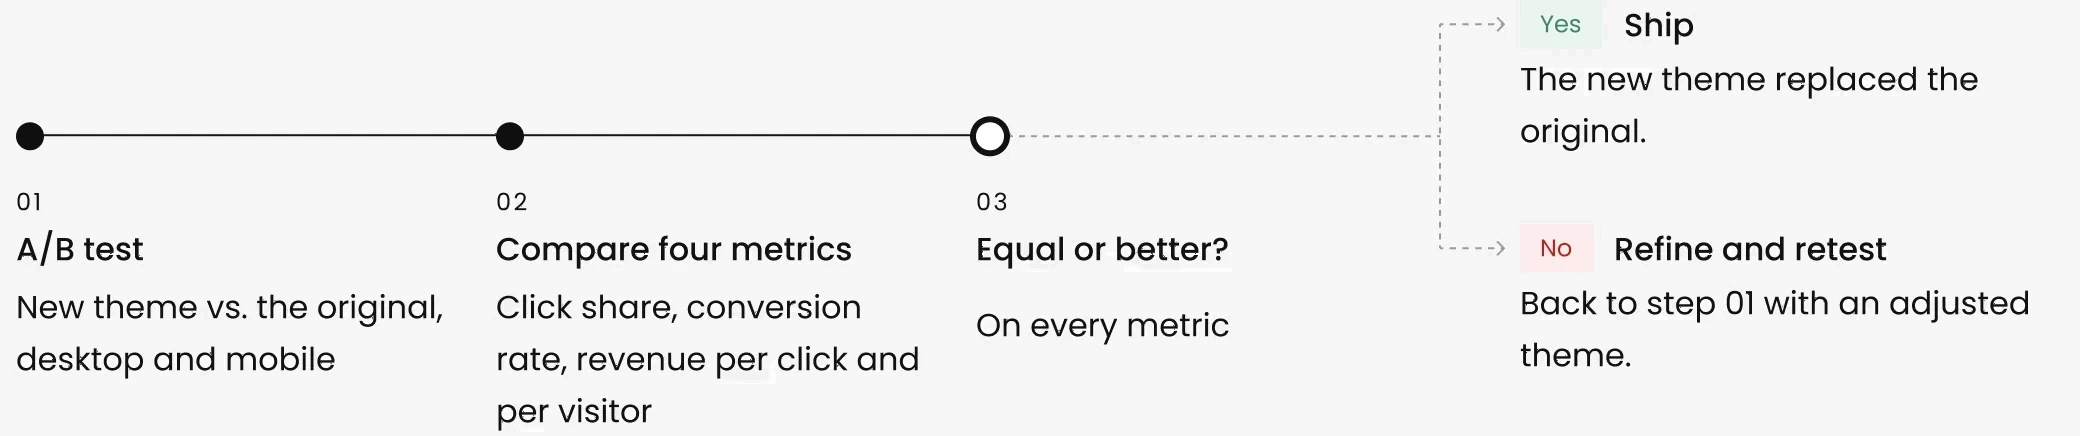
Results
All 21 verticals now run on the shared system, with no drop in performance on any of them.
What changed for the teams
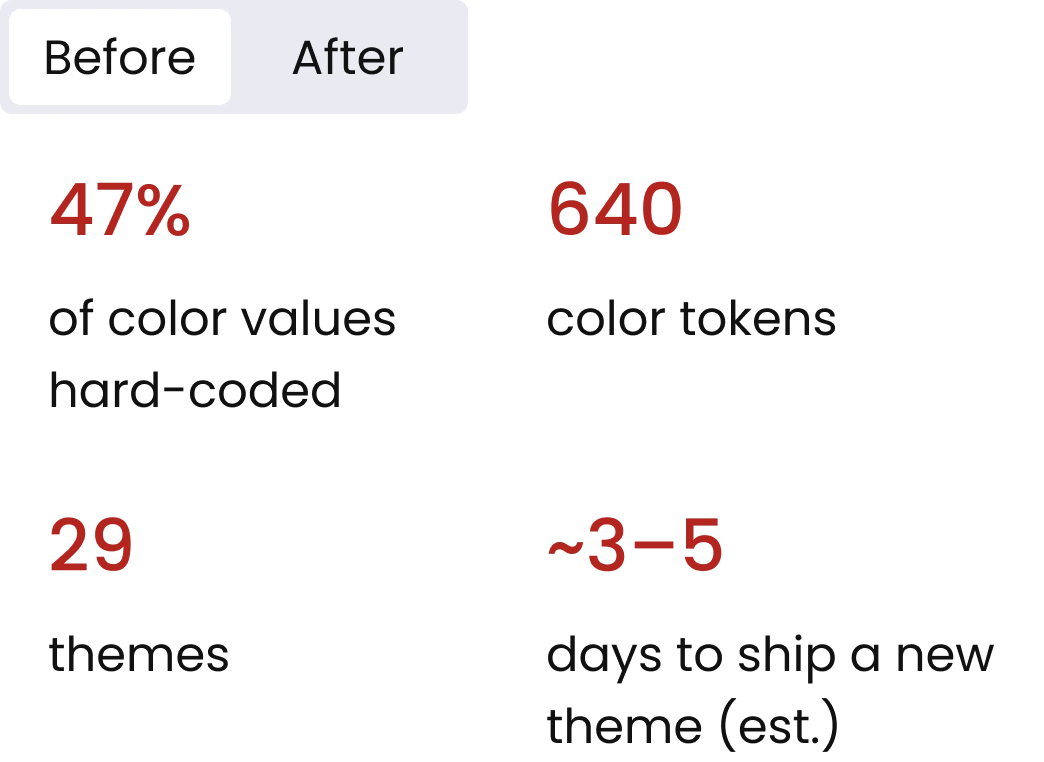
Before · Hard-coded
47%
of color values hard-coded
640
color tokens
29
themes
~3–5
days to ship a new theme (est.)
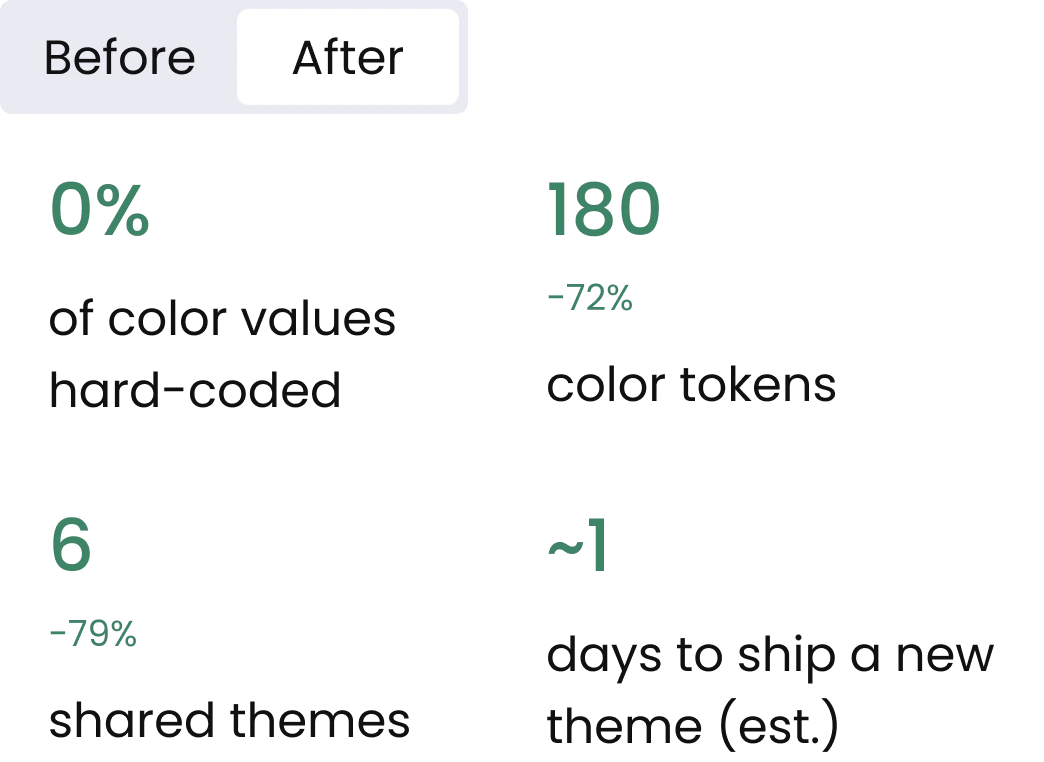
After · Tokens
0%
of color values hard-coded
180
−72%
color tokens
6
−79%
shared themes
~1
days to ship a new theme (est.)
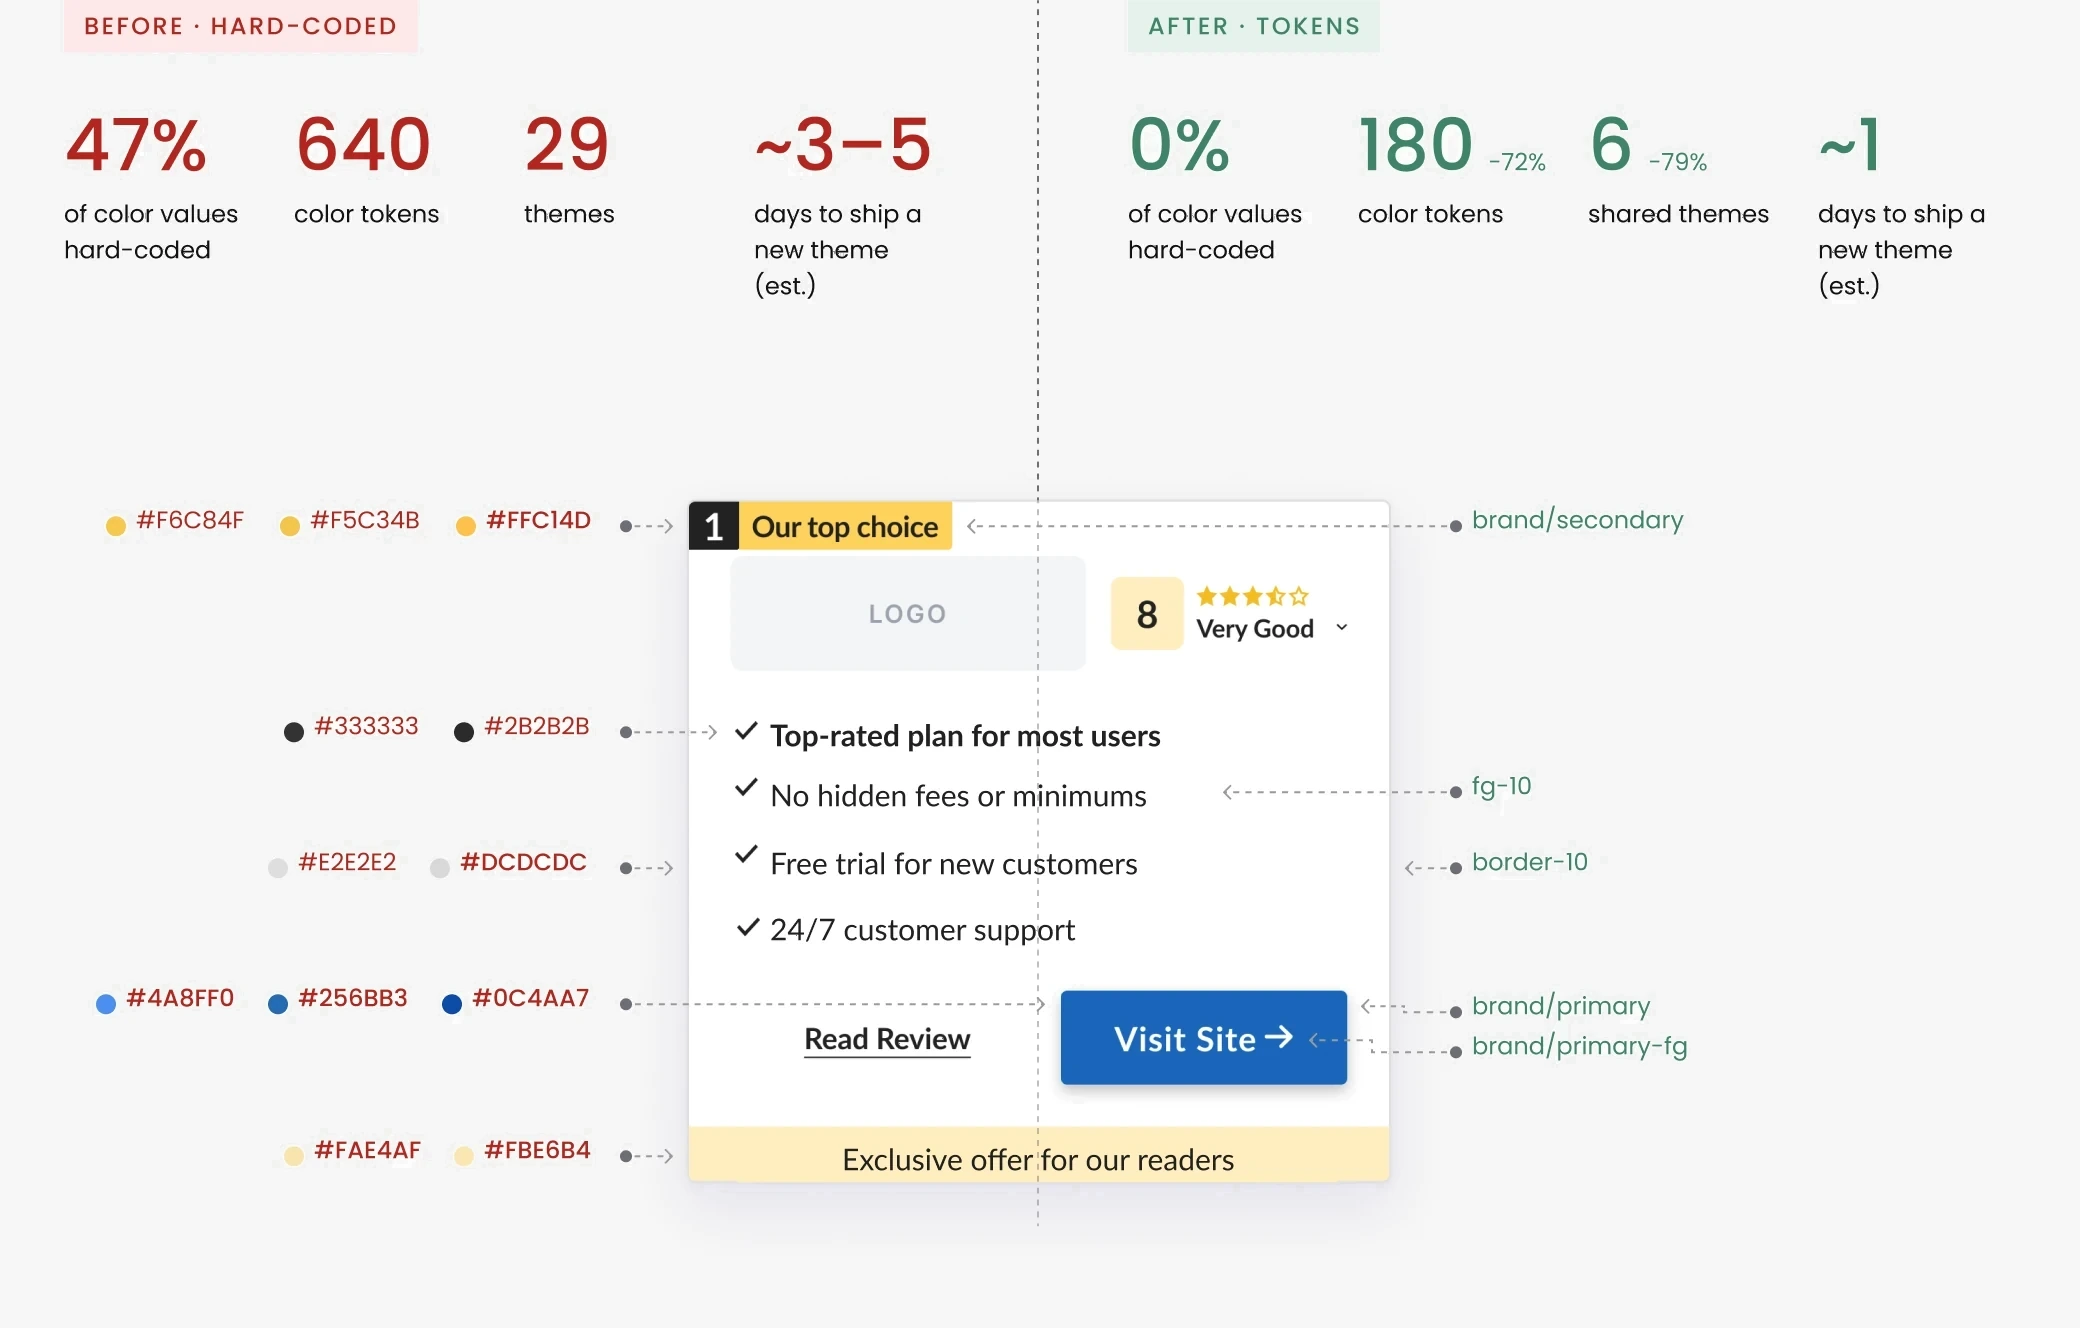
Most verticals looked the same after migrating; a few needed small adjustments to fit the shared palette.
What I learned
Looking back, most of the back-and-forth came from deciding each conflict on its own. Next time I’d agree with both teams on scope, decision owners and success criteria before the work starts, so disagreements are settled by rules we’ve already agreed on, not one by one.
Let’s talk.
Open to senior product design roles. Based in Tel Aviv, working in English, Hebrew and Spanish.
Design System: Color Architecture
Project details
COMPANY
Natural Intelligence
TIMEFRAME
9 months · Aug 2024
ROLE
Lead Product Designer
TEAM
2 designers · 2 devs
Cappsool and Better Impression, two Natural Intelligence companies, built the same kind of comparison product separately. I led the creation of one shared design system for both, cutting duplicated work while keeping each brand’s identity and years of A/B-tested design.
Result: One system now serves both companies. Themes ship and A/B test faster, with 72% fewer color tokens and 6 shared themes instead of 29.
The problem
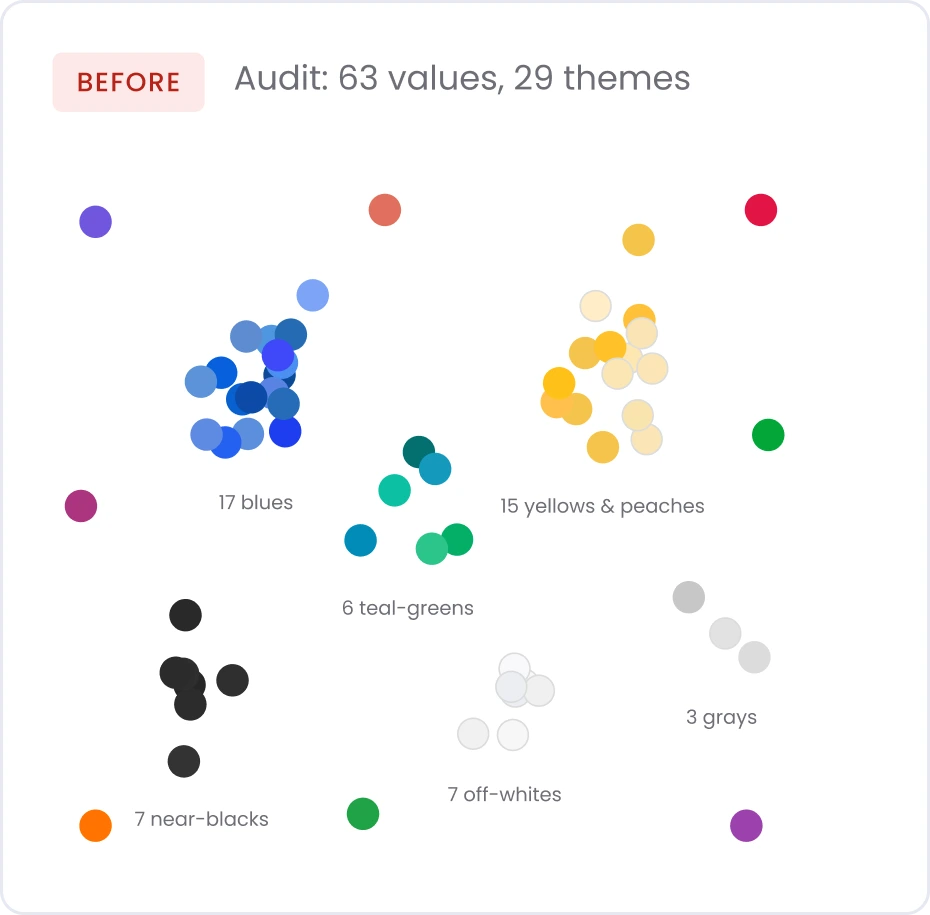
Repeated color palettes
Overlapping hue families, defined separately. Two sources of truth that drifted apart.
Inconsistent color names
Colors were named by mood (“calm”, “calmer”) instead of a scale (“Blue 300”), so the names didn’t show how colors related.
calmer
→
Blue 300
Duplicated design & code
21 verticals across 2 companies, each on its own platform and its own design system. The same features were built from scratch in both.
Cappsool DS
Better Impression DS
Business impact
Slower delivery: 47% of colors were hard-coded, so theme changes meant editing each vertical by hand.
main challenge
Unify both systems under one token structure, without visible changes or losing the details that had already won A/B tests.
Ownership
I led
Color system
Audit
Token architecture
Accessibility decisions
Rating decisions
Aligning product and engineering
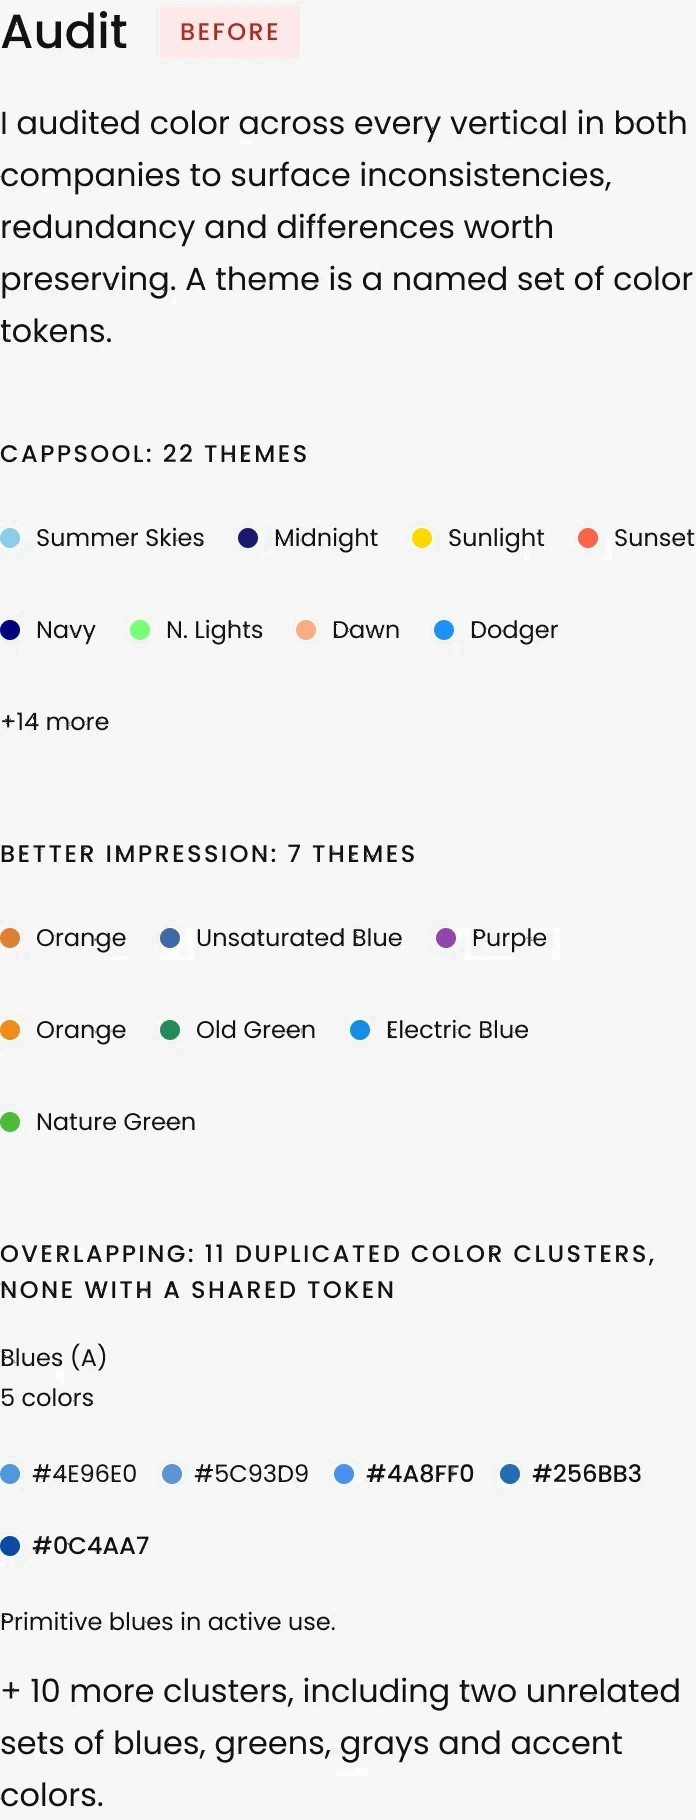
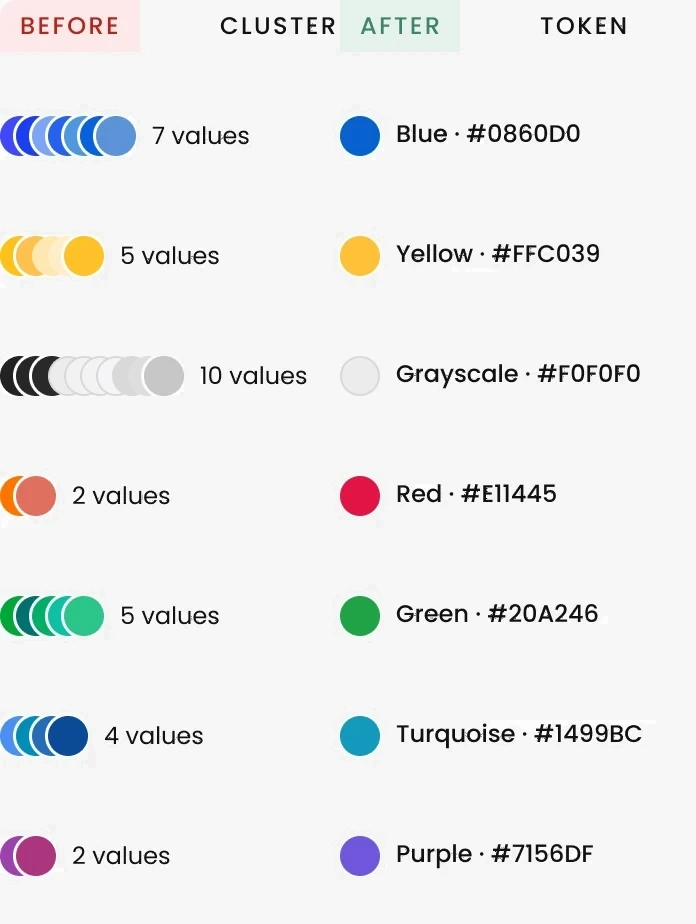
Consolidation
35 colors consolidated into 7 base tones. Each one seeds a full scale (100, 200, 300…) of primitive tokens.
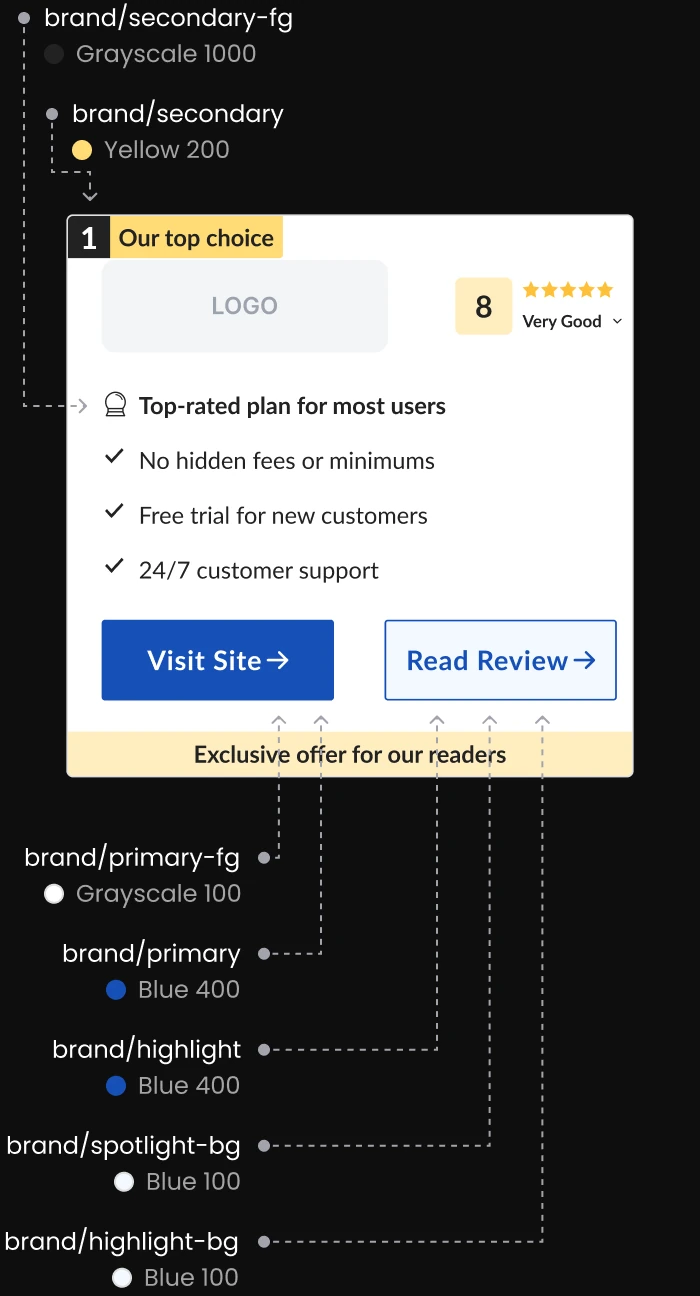
Architecture
Primitives → semantic tokens → system tokens. Themes can be swapped without touching any component.
Primitive tokens
The raw palette: each color family in a numbered scale (Blue 100, Blue 200…).
Semantic tokens
The partner card is the core conversion component across all verticals.
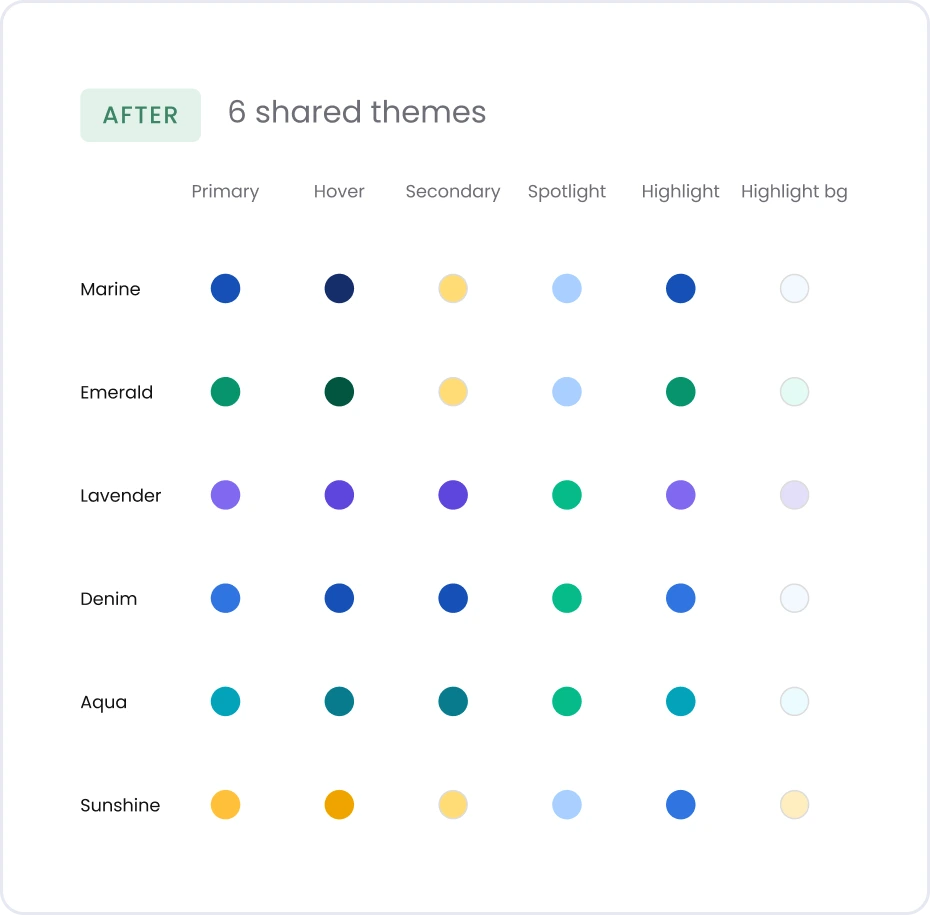
Where the themes started
Cappsool
Marine
Emerald
Sunshine
Better Impression
Lavender
Denim
Aqua
Today either company can use any theme, as long as the two never use the same theme on the same vertical.
System tokens
Shared UI colors for text, borders and status (like negative or positive), each with a light and a dark value.
Tracing one color
Raw value
#1650b7

Primitive token (Layer 01)
Blue 400
#1650b7
Semantic token (Layer 02, Marine)
brand/primary
#1650b7
Applied
Label
From Figma to code
I built the Figma variables and tokens, with one naming convention for designers and developers from day one, and shared them as the single source. An external design-system consultancy guided the structure and stayed on call for support. Today anyone on the design team builds with it.
Decision: ratings
I owned the decision on how to differentiate the two companies’ ratings.
SEO risk
It had happened before: Google flagged near-identical pages as duplicate content.
vs
Proven performance
These colors had already won A/B tests.
How I got there
Iteration 2: My decision
CHOSEN
Two swappable rating systems, Golden and Forest.
Marine theme
Golden
Marine theme

Forest
Any theme, either rating
Built from the same validated colors, so nothing had to be re-tested.
The problem
Both companies used the same rating colors.
Cappsool
Golden
Better Impression
Golden
✕
Pages looked like duplicates
Iteration 1: What I tried
Rating colors as tokens inside each company’s theme.
Marine theme
Golden, locked
Lavender theme
Forest, locked
✕
Changing the rating meant changing the theme
Outcome
Golden started as Cappsool’s rating and Forest as Better Impression’s. Now no theme owns a rating color.
Decision: contrast
With no one owning the shared outcome, conflicts between the two teams stalled. The position badge is one example.
Product
Protected proven theme details.
vs
Engineering
Wanted one system, no exceptions.
How I got there
Iteration 2: My decision
CHOSEN
Original yellow, with its own foreground token.
Marine

secondary
secondary-fg (new)
Lavender

secondary
secondary-fg (new)
Original color, readable text
The problem
One shared white foreground on every theme.
Marine

secondary
primary-fg
Lavender

secondary
primary-fg
✕
White text unreadable
Iteration 1: What I tried
Darken the yellow so white text stays readable.
Marine

secondary → #F8B700
primary-fg
Lavender

secondary
primary-fg
✕
Readable, but the proven color changed
Outcome
6/6 themes pass AA, 0 component changes.
Validation
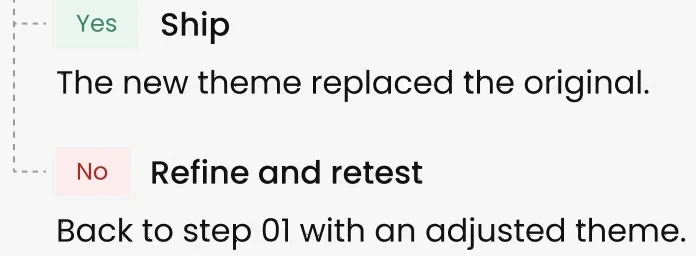
Engineering migrated both companies to one platform, one vertical at a time.
How each theme was tested

01
A/B test

02
Compare four metrics

03
Equal or better?
Results
All 21 verticals now run on the shared system, with no drop in performance on any of them.
What changed for the teams
Most verticals looked the same after migrating; a few needed small adjustments to fit the shared palette.
What I learned
Looking back, most of the back-and-forth came from settling each conflict on its own. Next time I’d agree on scope, decision owners and success criteria with both teams up front.
Let’s talk.
Open to senior product design roles. Based in Tel Aviv, working in English, Hebrew and Spanish.
Earning Trust in AI Summaries
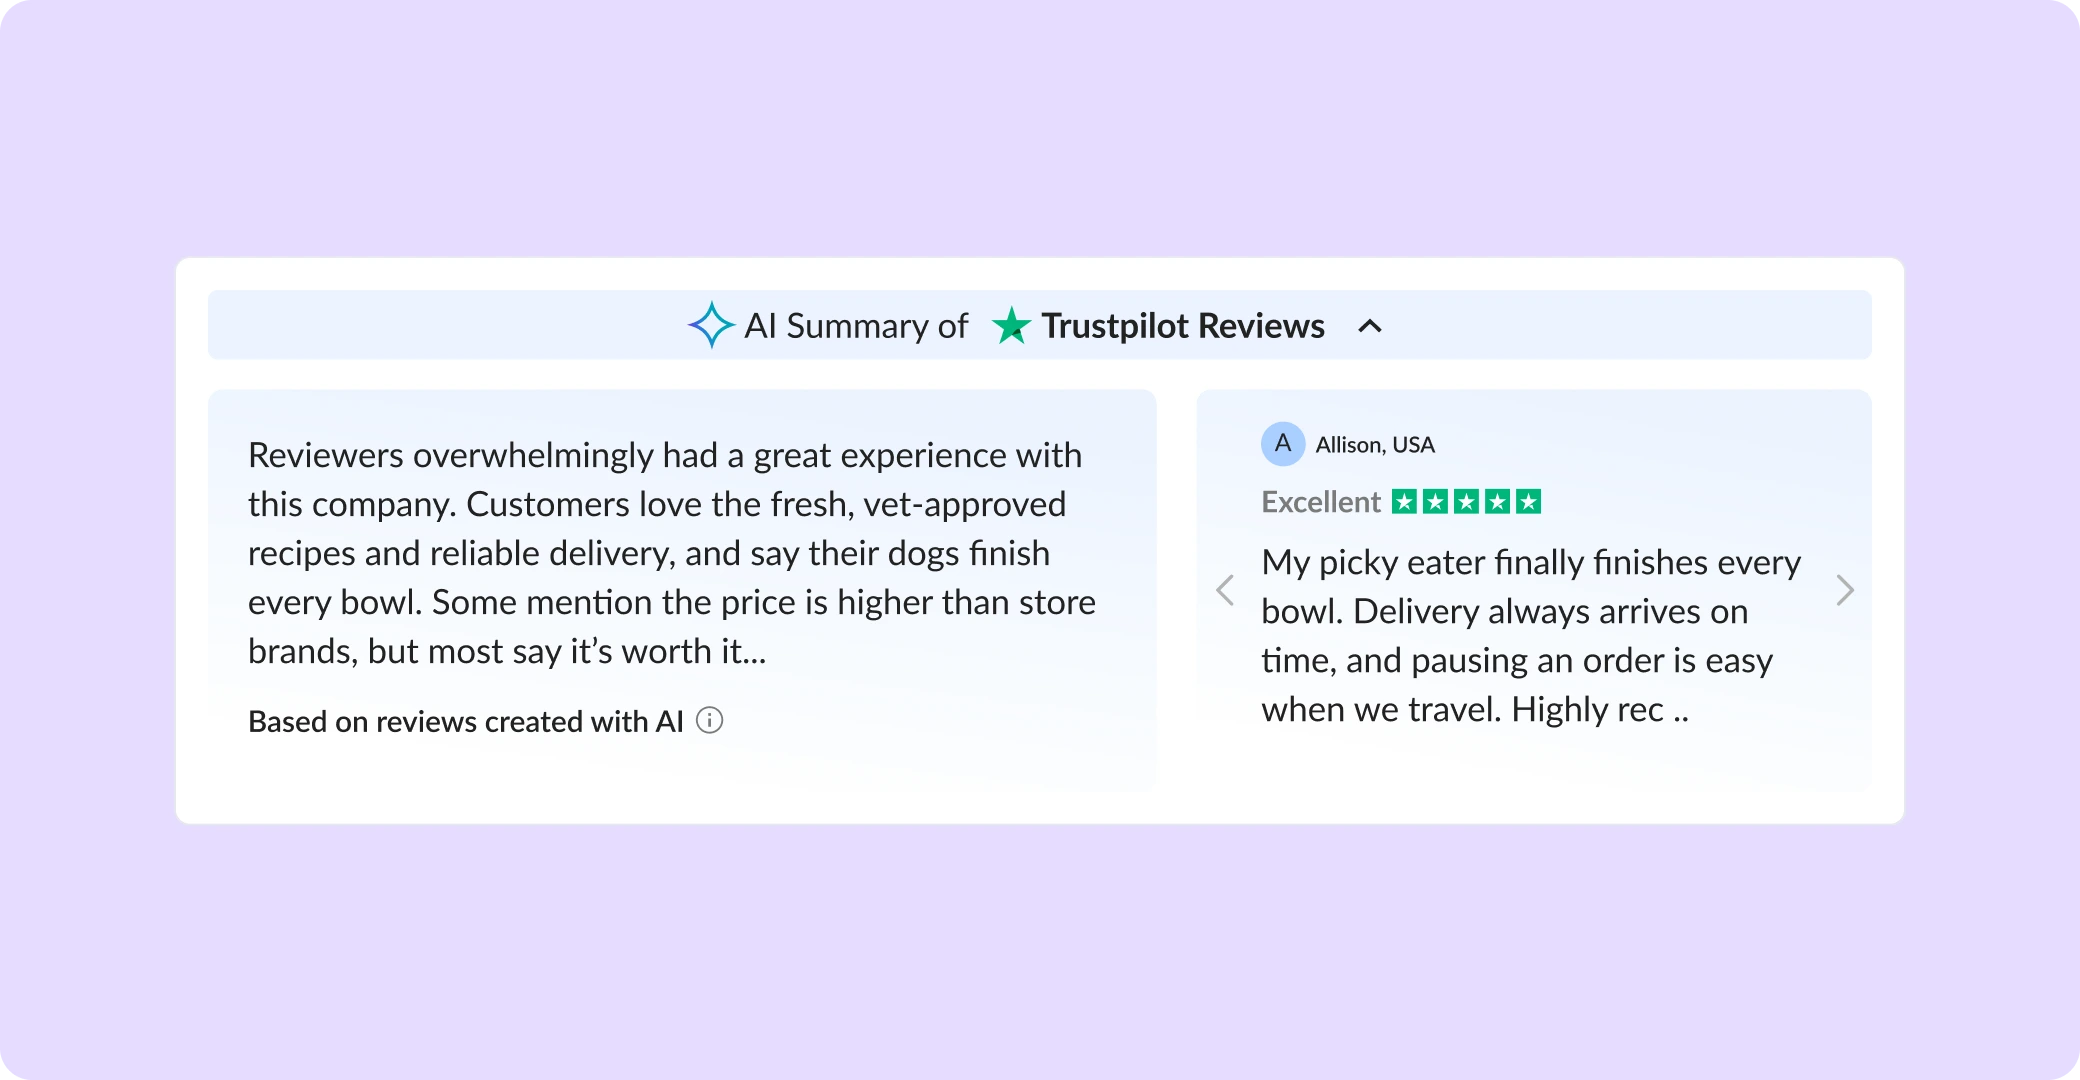
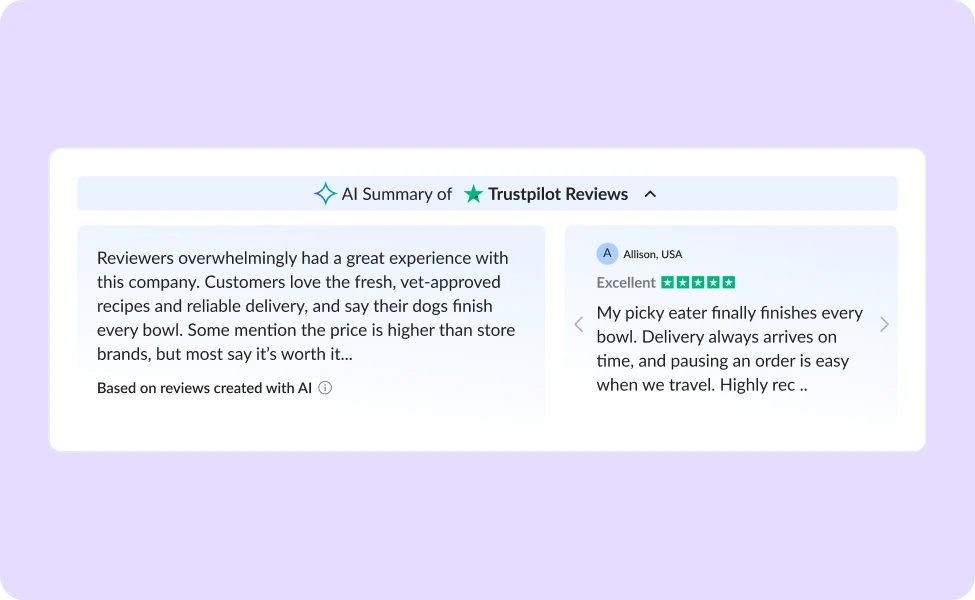
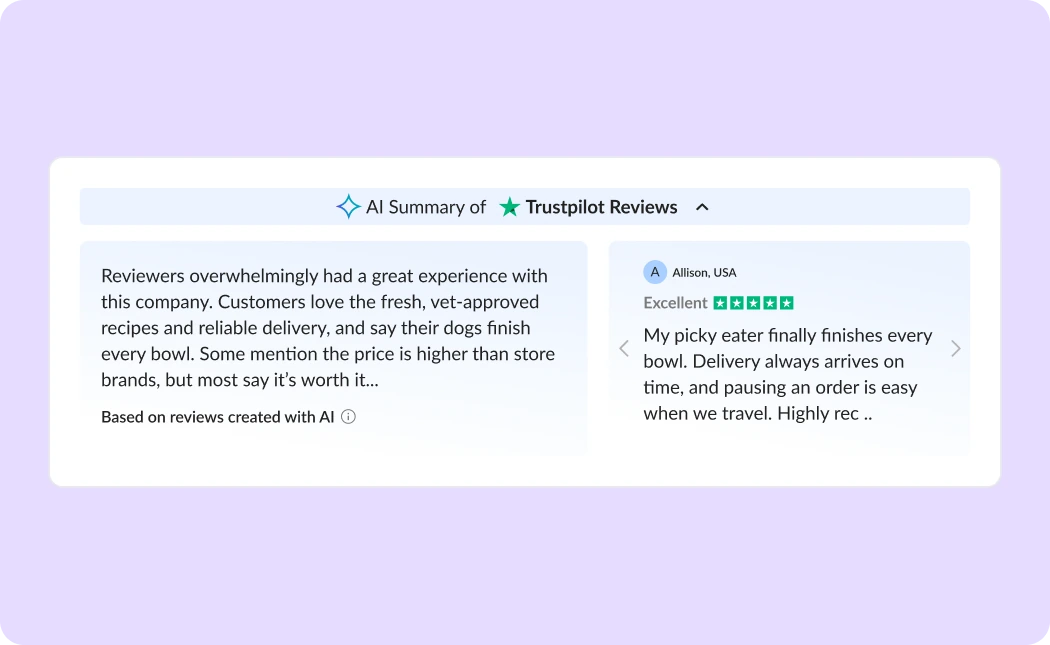
Cappsool’s comparison sites earn revenue when users click through to a partner and convert. I led the research, design and handoff specs for an AI summary of real Trustpilot reviews on the top partner’s card, replacing a bare rating with real customer sentiment, without compromising the business model.
Result: A handoff-ready design for desktop and mobile. It didn’t reach its A/B test: shifting priorities and repeated scope changes kept deprioritizing it.
COMPANY
Cappsool
TIMEFRAME
1 month · Sep 2025
ROLE
Senior Product Designer
TEAM
1 PM · 1 designer · 1 developer
The problem
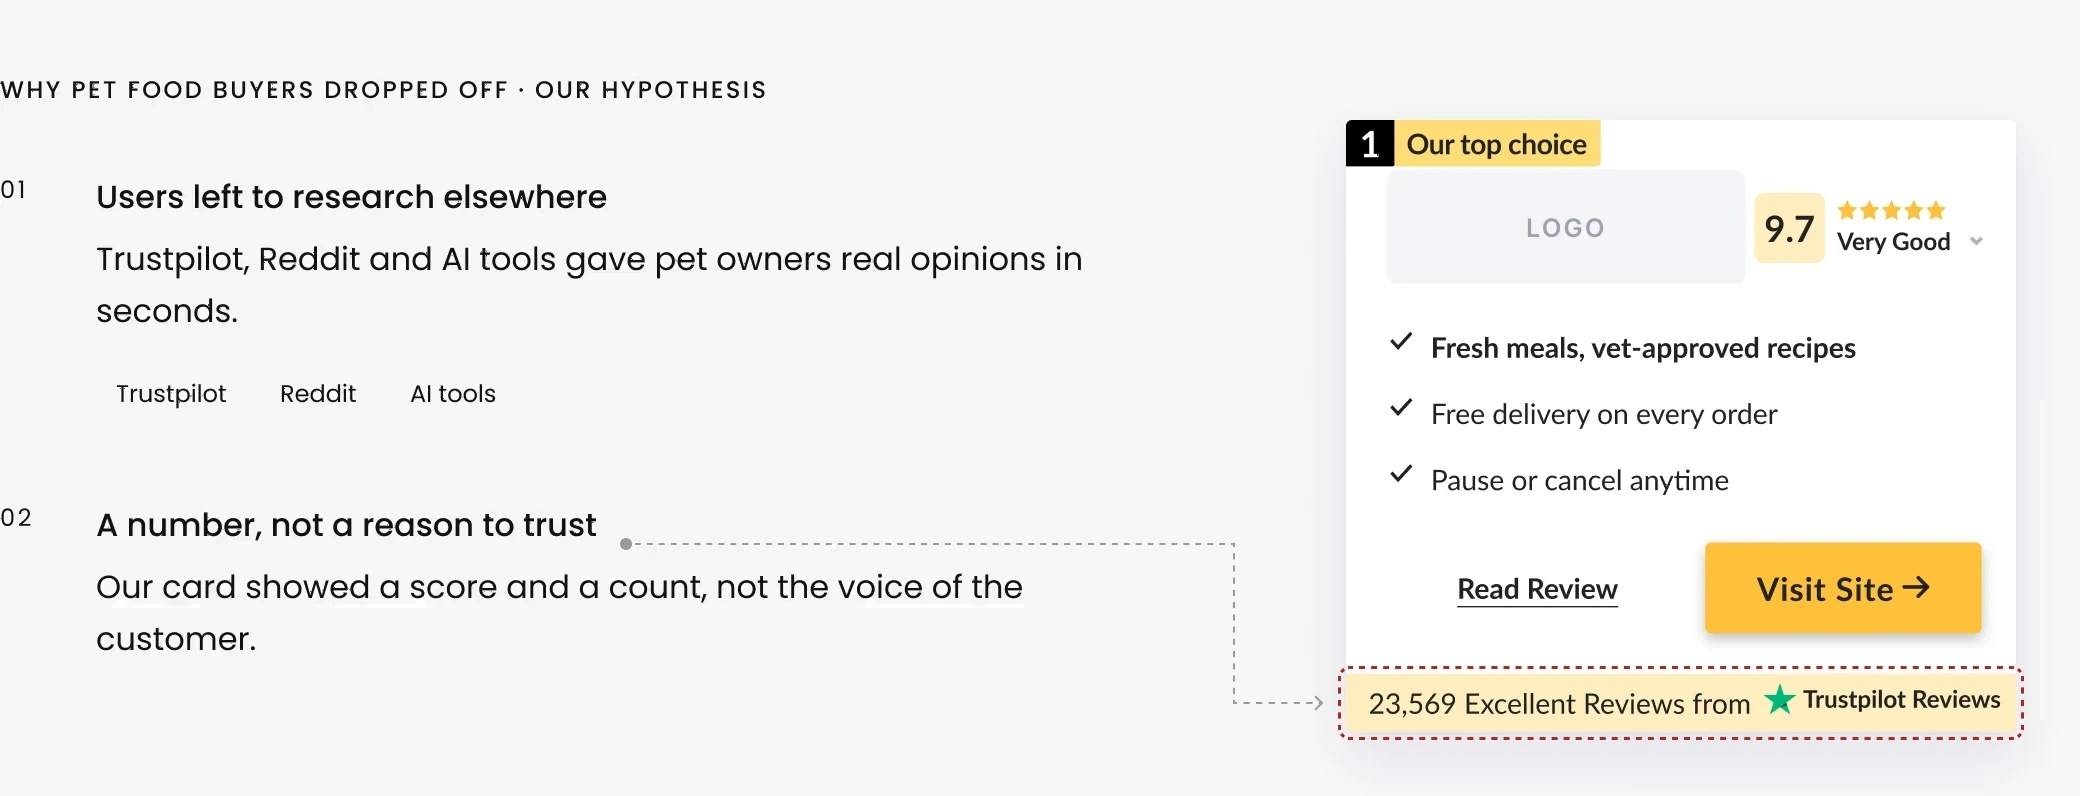
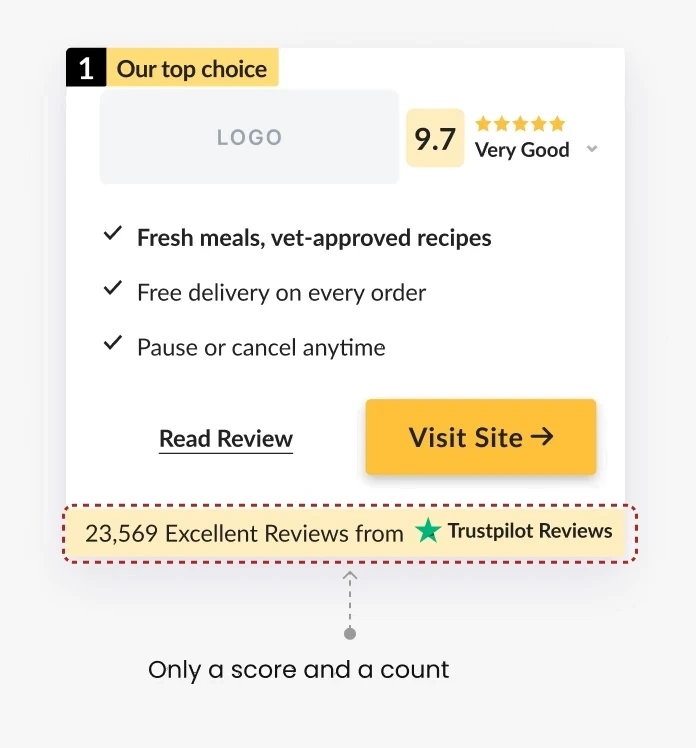
Our top partner underperformed on conversion in pet food, a category where buyers rely heavily on reviews. The card offered only a Trustpilot badge: users clicked through, but few converted into leads.
The business signal

The brief
One scannable overview of what customers say, on the top partner’s card: overall sentiment, recurring themes and the general impression.
Design goals
Real sentiment, fair ranking
Surface real customer sentiment without demoting other partners.
1
2
3
AI text people trust
Make AI content credible and clearly labeled.
✦ Based on reviews created with AI
Few card changes
Lift conversion rate with minimal changes to a proven card.
AI Summary of ★ Reviews ⌃
The challenge
Add AI that builds trust, without losing what drives clicks to our partners.
Real reviews wouldn’t always support our ranking.
User trust
and
Business model
Research
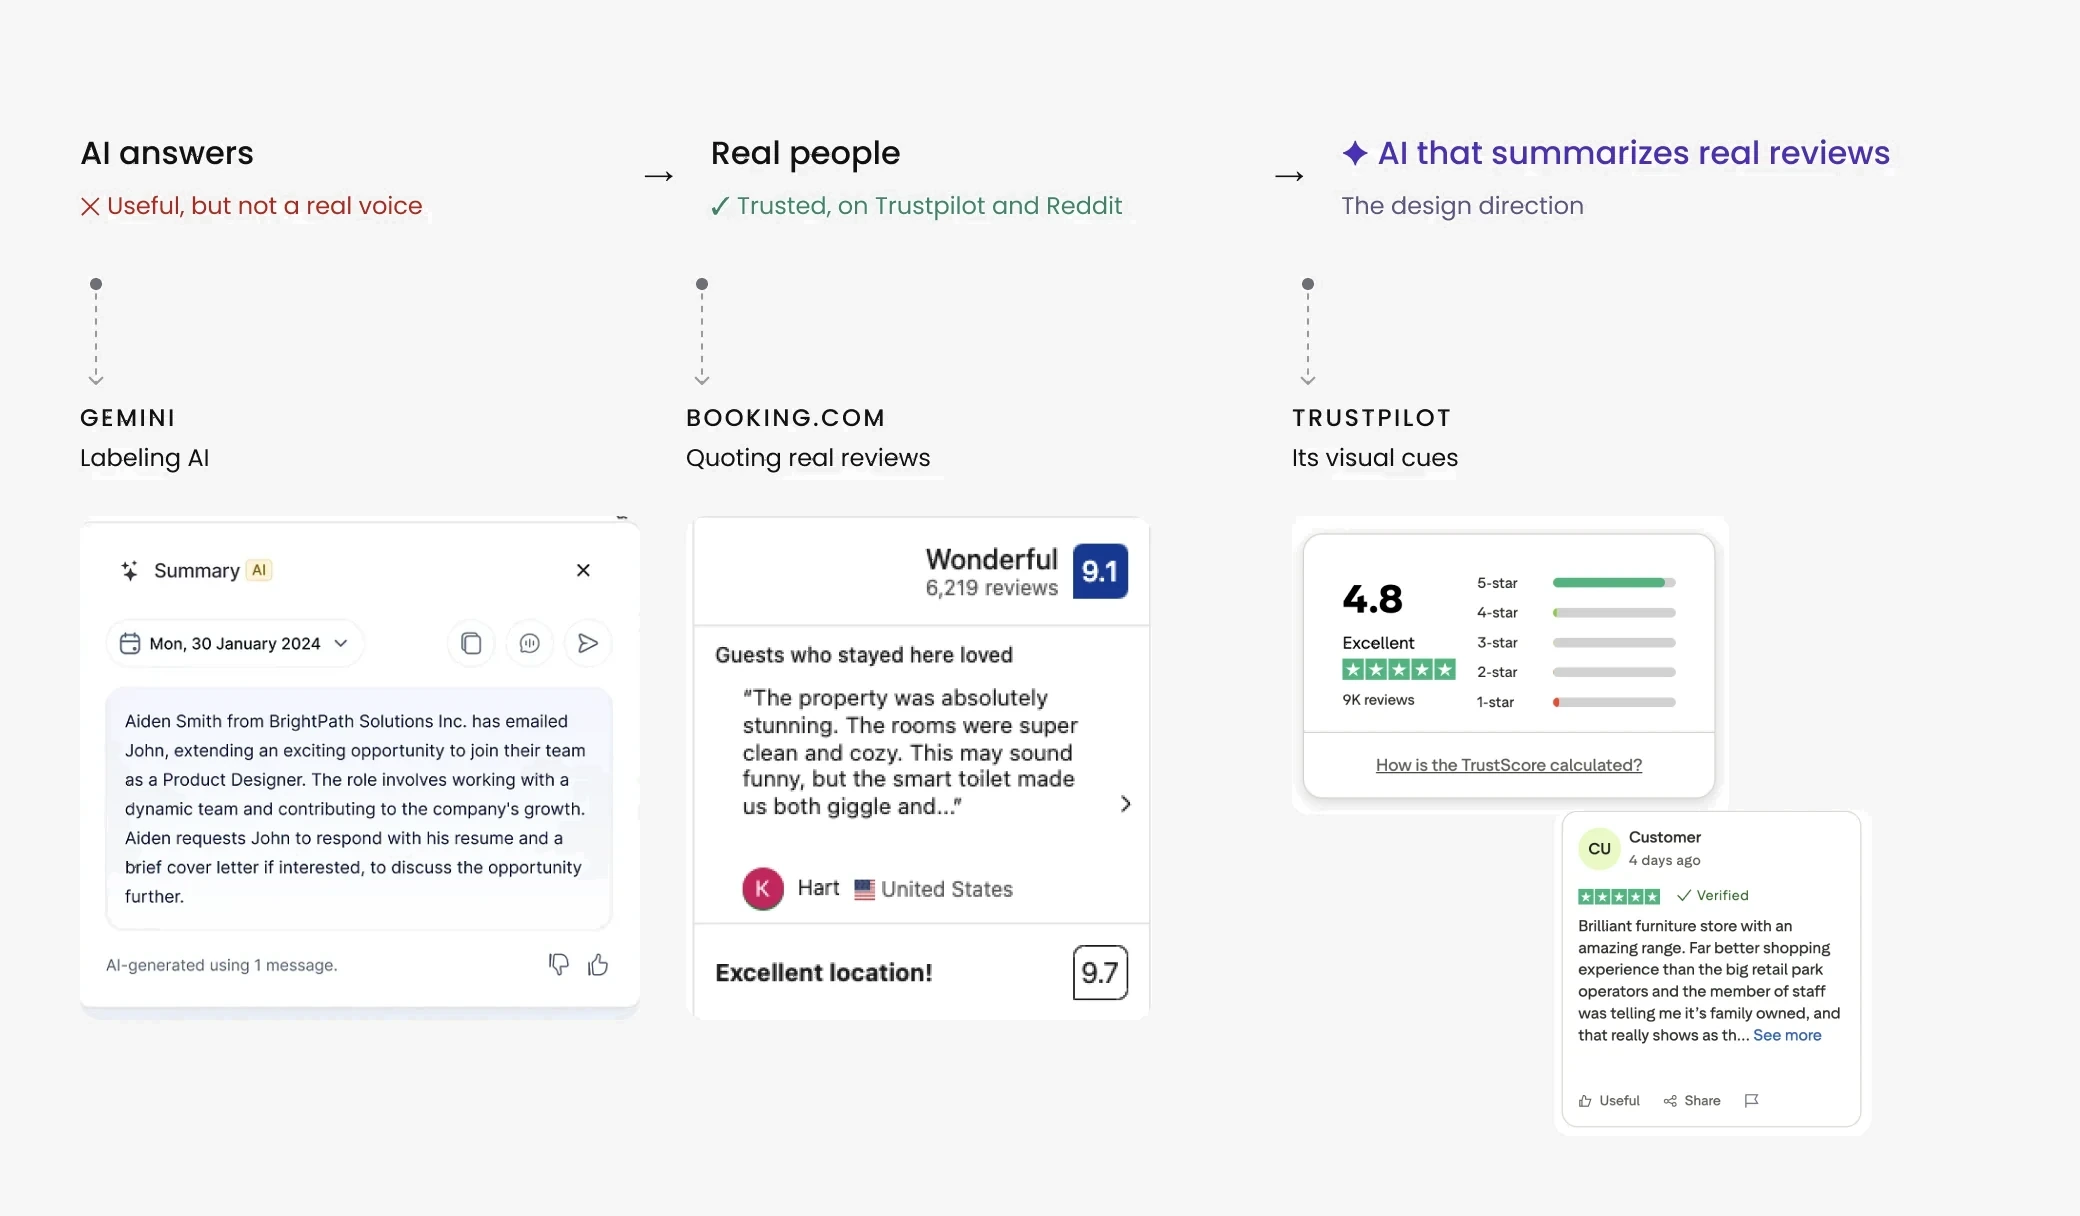
Earlier user testing I ran on Cappsool’s comparison sites, plus a review of how Gemini, Booking.com and Trustpilot present reviews, pointed to one principle: people trust real users more than any other source.
Explorations
I started with the structure: a side overlay first, then the summary inside the card, exploring two review patterns from the research, Trustpilot’s rating breakdown and Booking.com’s quoted reviews.
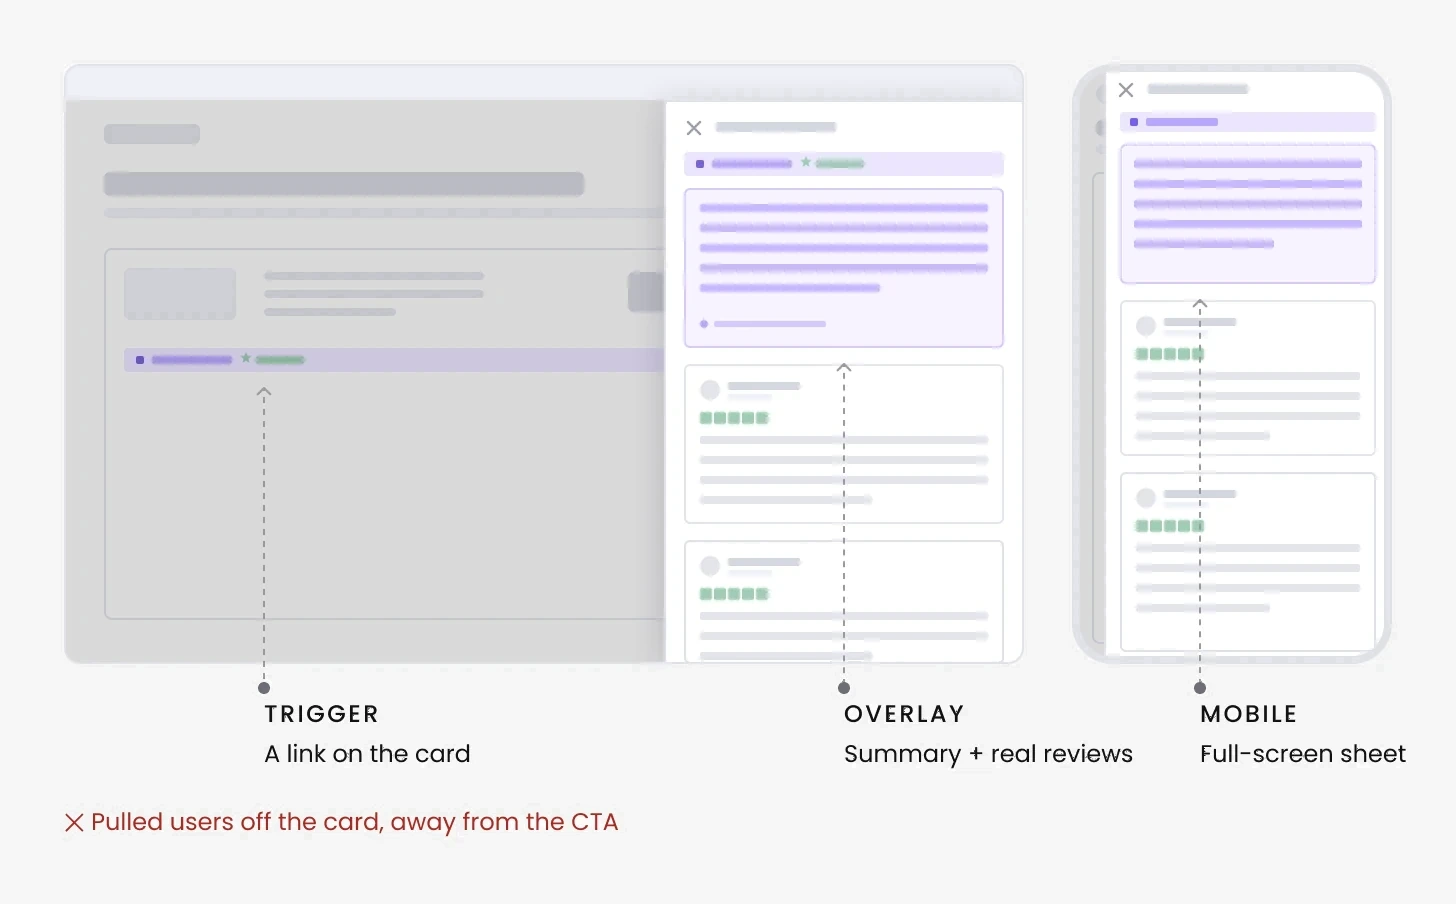
Iteration 1
Side overlay
A link on the card opened a panel from the right, with the AI summary and real reviews.
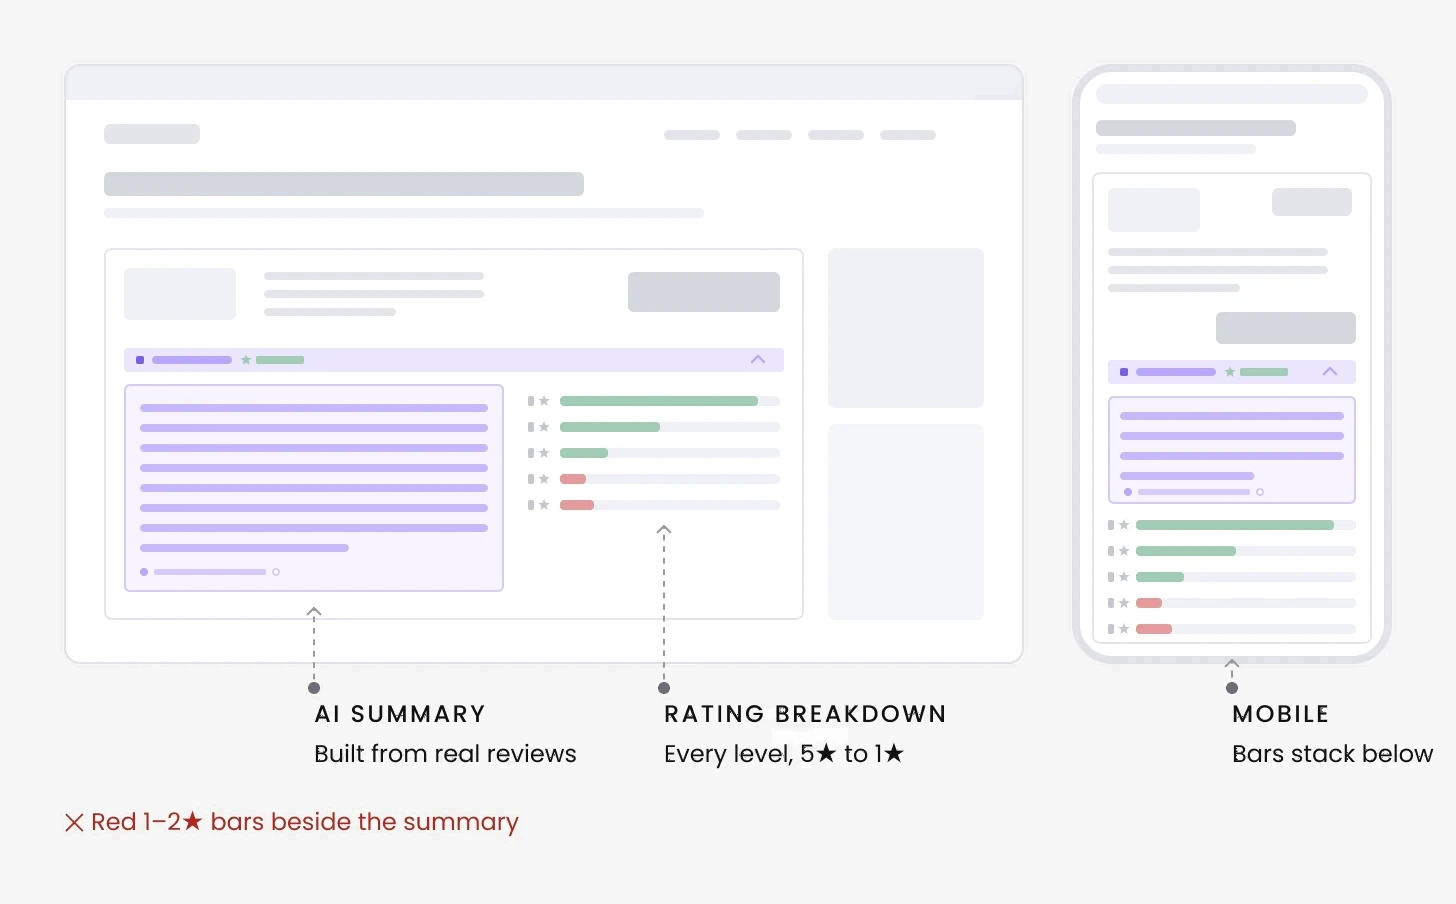
Iteration 2
Summary + ratings on the side
A full breakdown exposes every rating, so red 1–2★ bars would sit right next to the CTA.
Iteration 3
CHOSEN
Summary + review carousel on the side
The Trustpilot API lets us filter which reviews appear, but not the rating distribution. Positive quotes add a human voice.
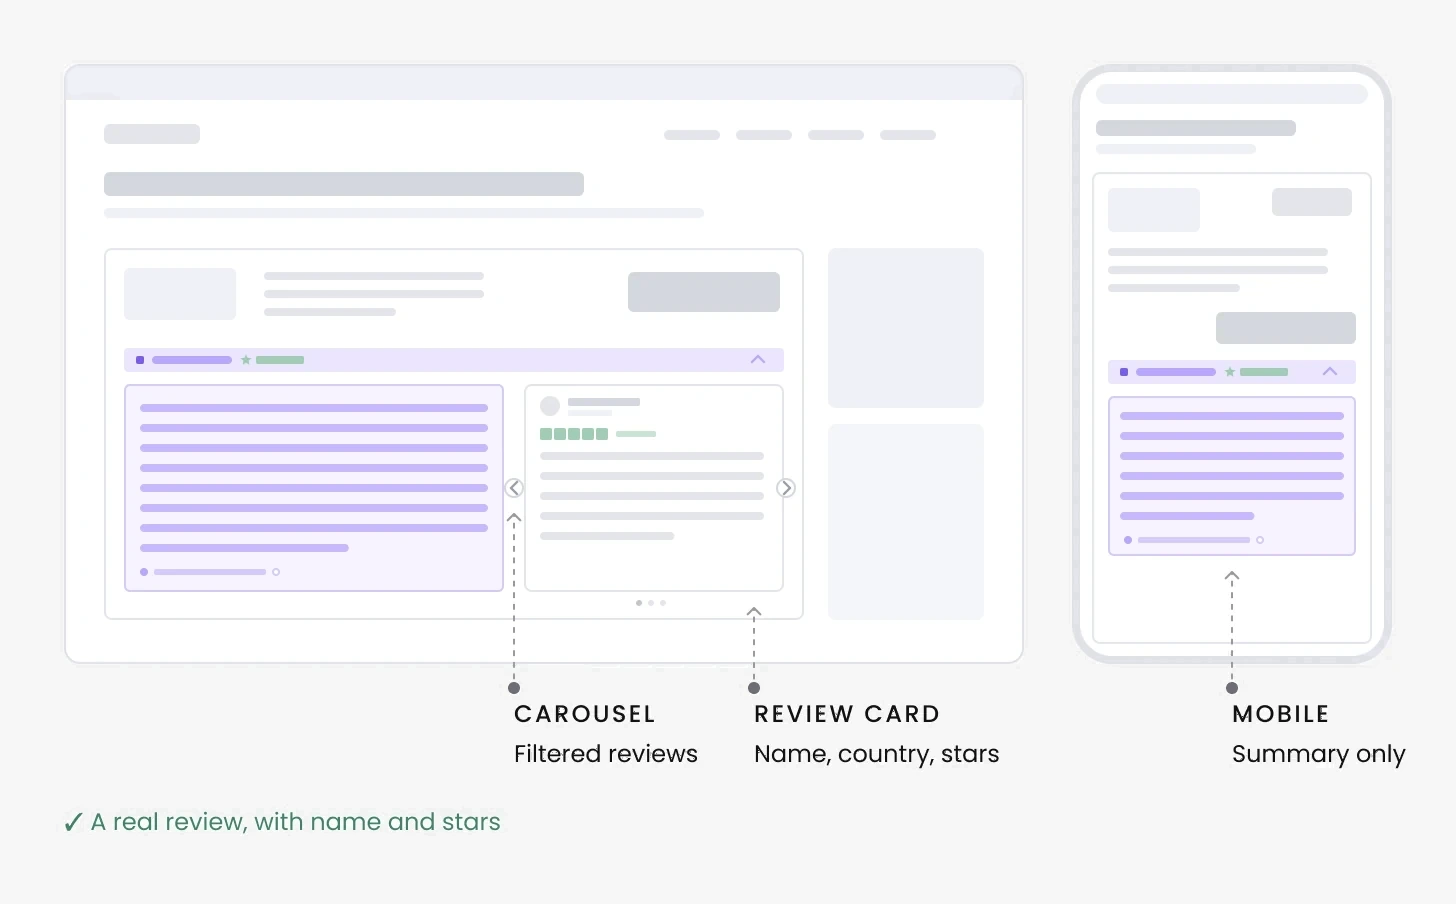
Outcome
On desktop: open by default, with real reviews beside it. The quotes beside it are filtered to positive ones. That was a trade-off between transparency and conversion, so the AI label and the Trustpilot source stay visible on the card.
Decision: the card
With the carousel chosen, the first decision was what the card shows.
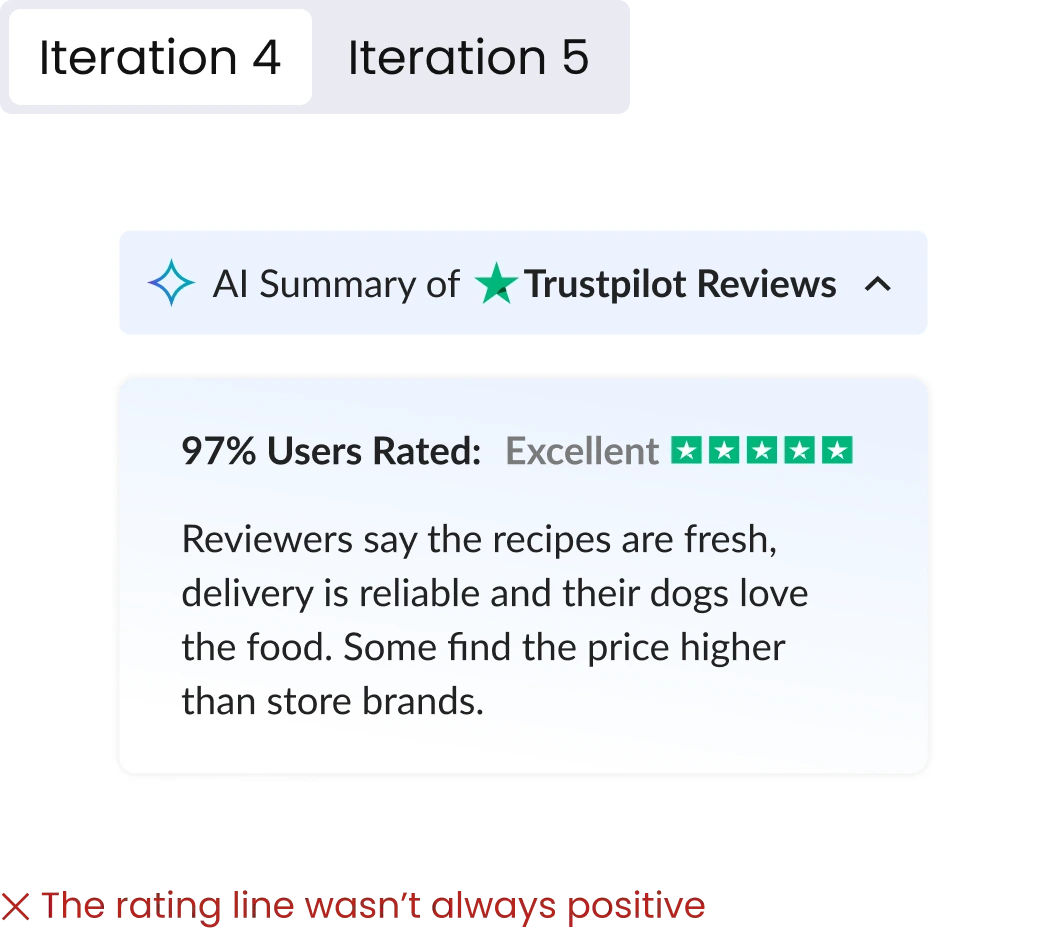
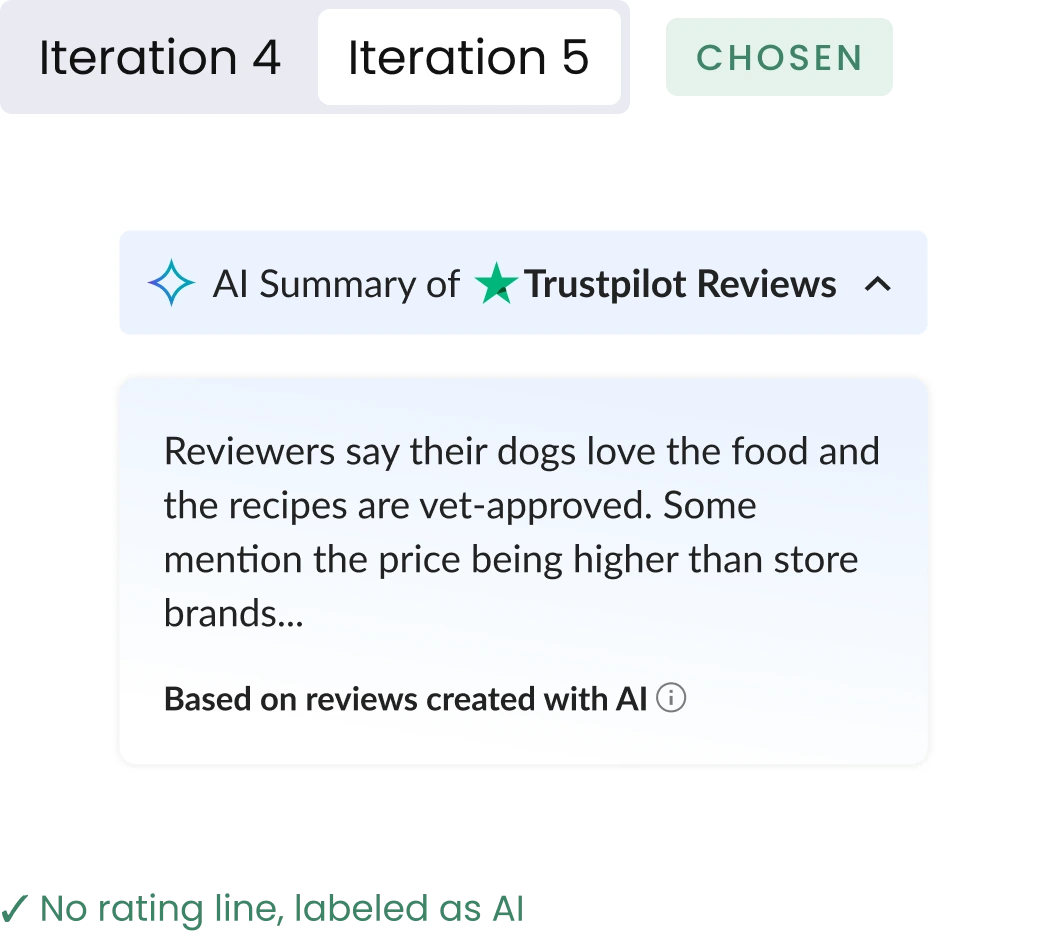
On the card: rating line or no rating line
Iteration 4 swapped the breakdown for a single rating line.
Iteration 4
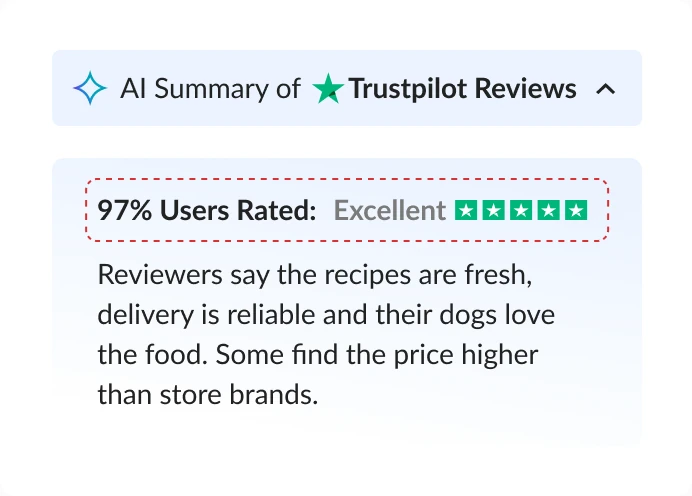
✕ The rating line wasn’t always positive
Iteration 5
CHOSEN
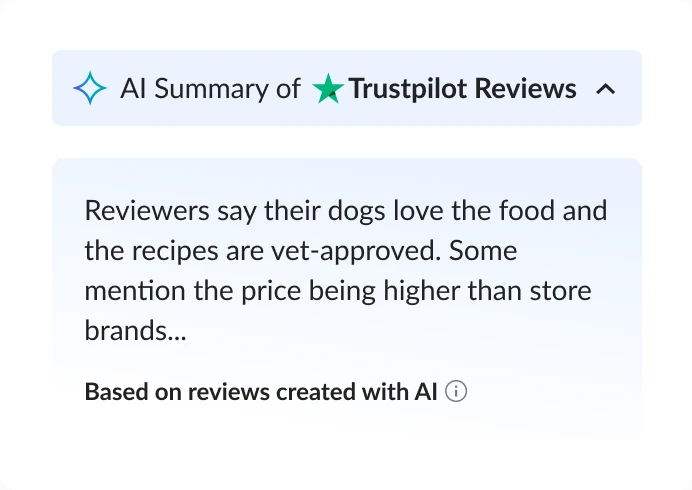
✓ No rating line, labeled as AI
Decision
No rating line on either screen. The labeled summary carries the message.
trade-off
Less detail at a glance, but nothing on the card works against the click. The partner’s score is already on the card.
Decision: mobile default
With the card settled, the last decision was the mobile default. About 70% of pet food traffic was mobile (Google Analytics), where the desktop pattern took too much space.
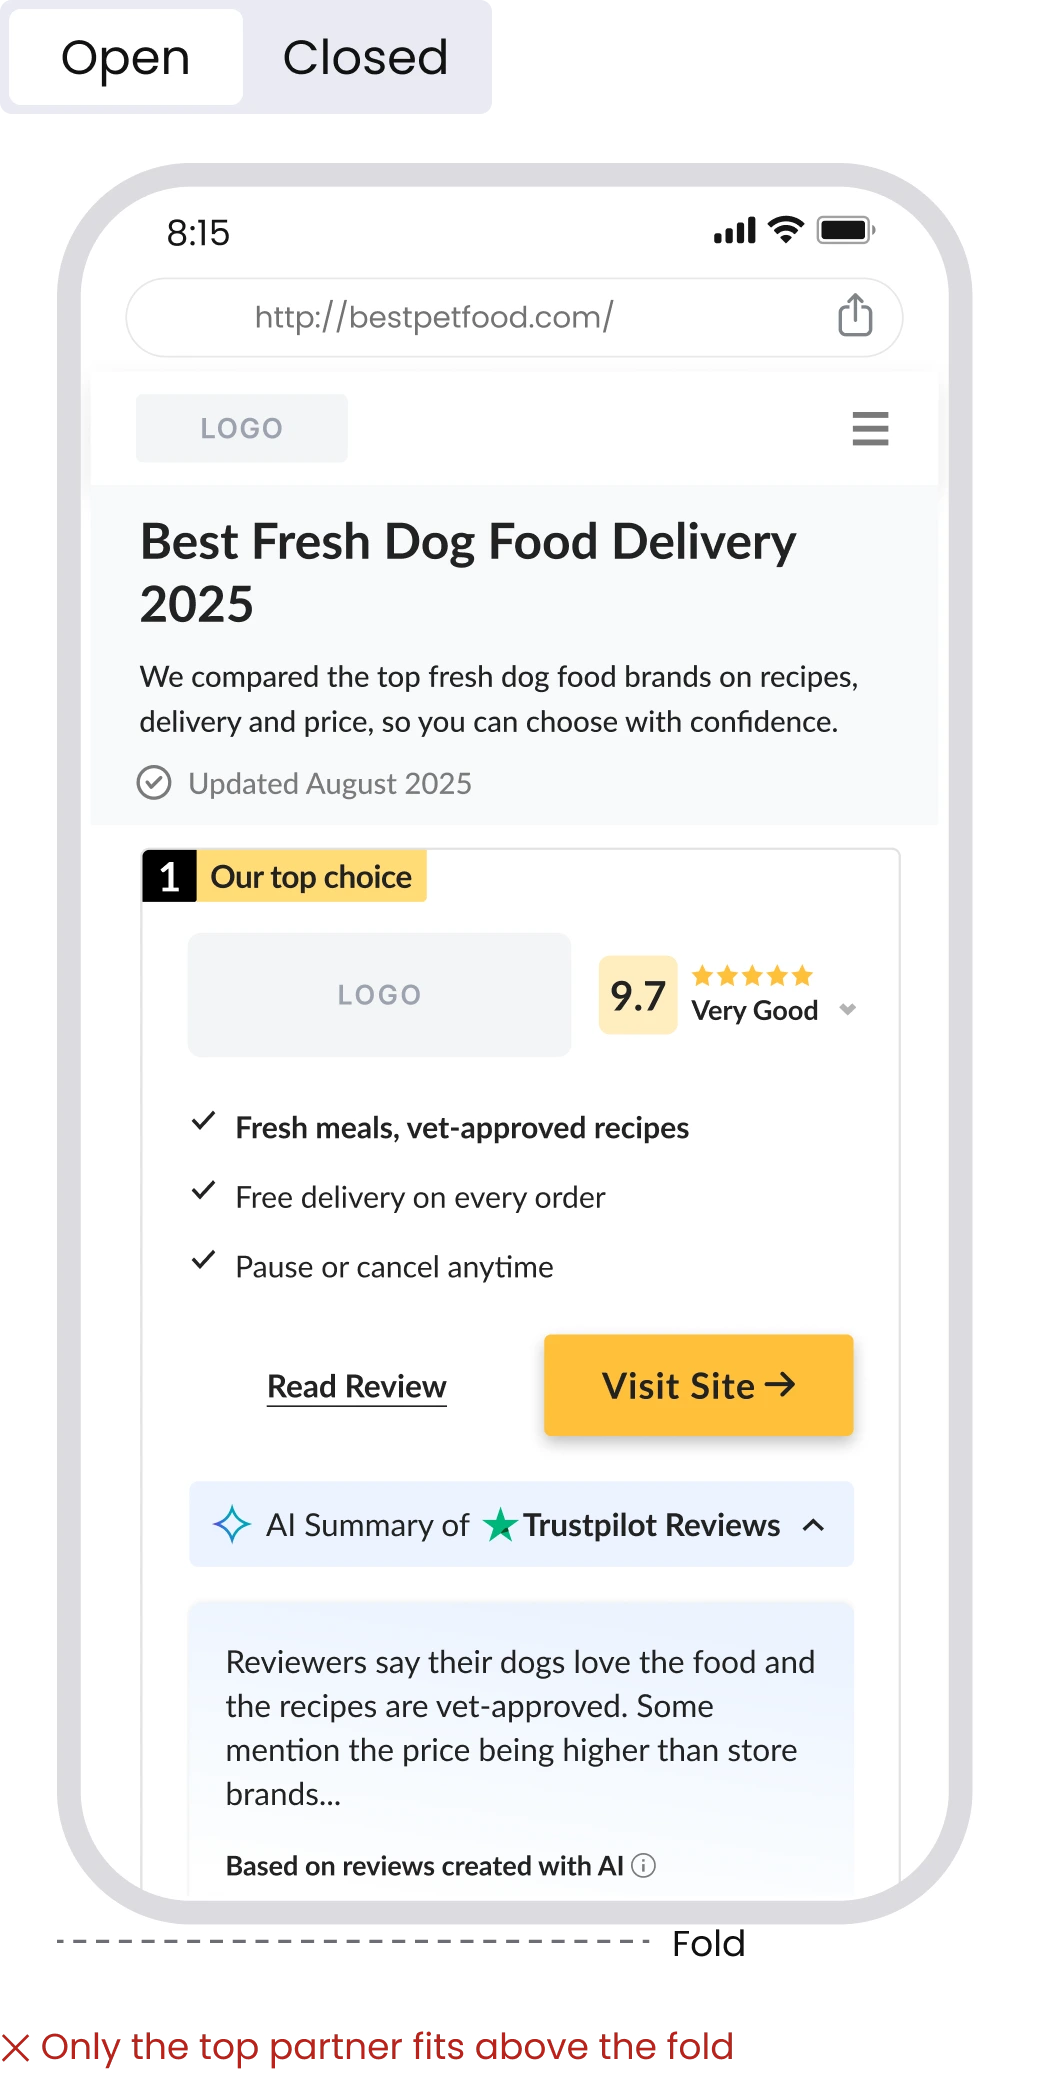
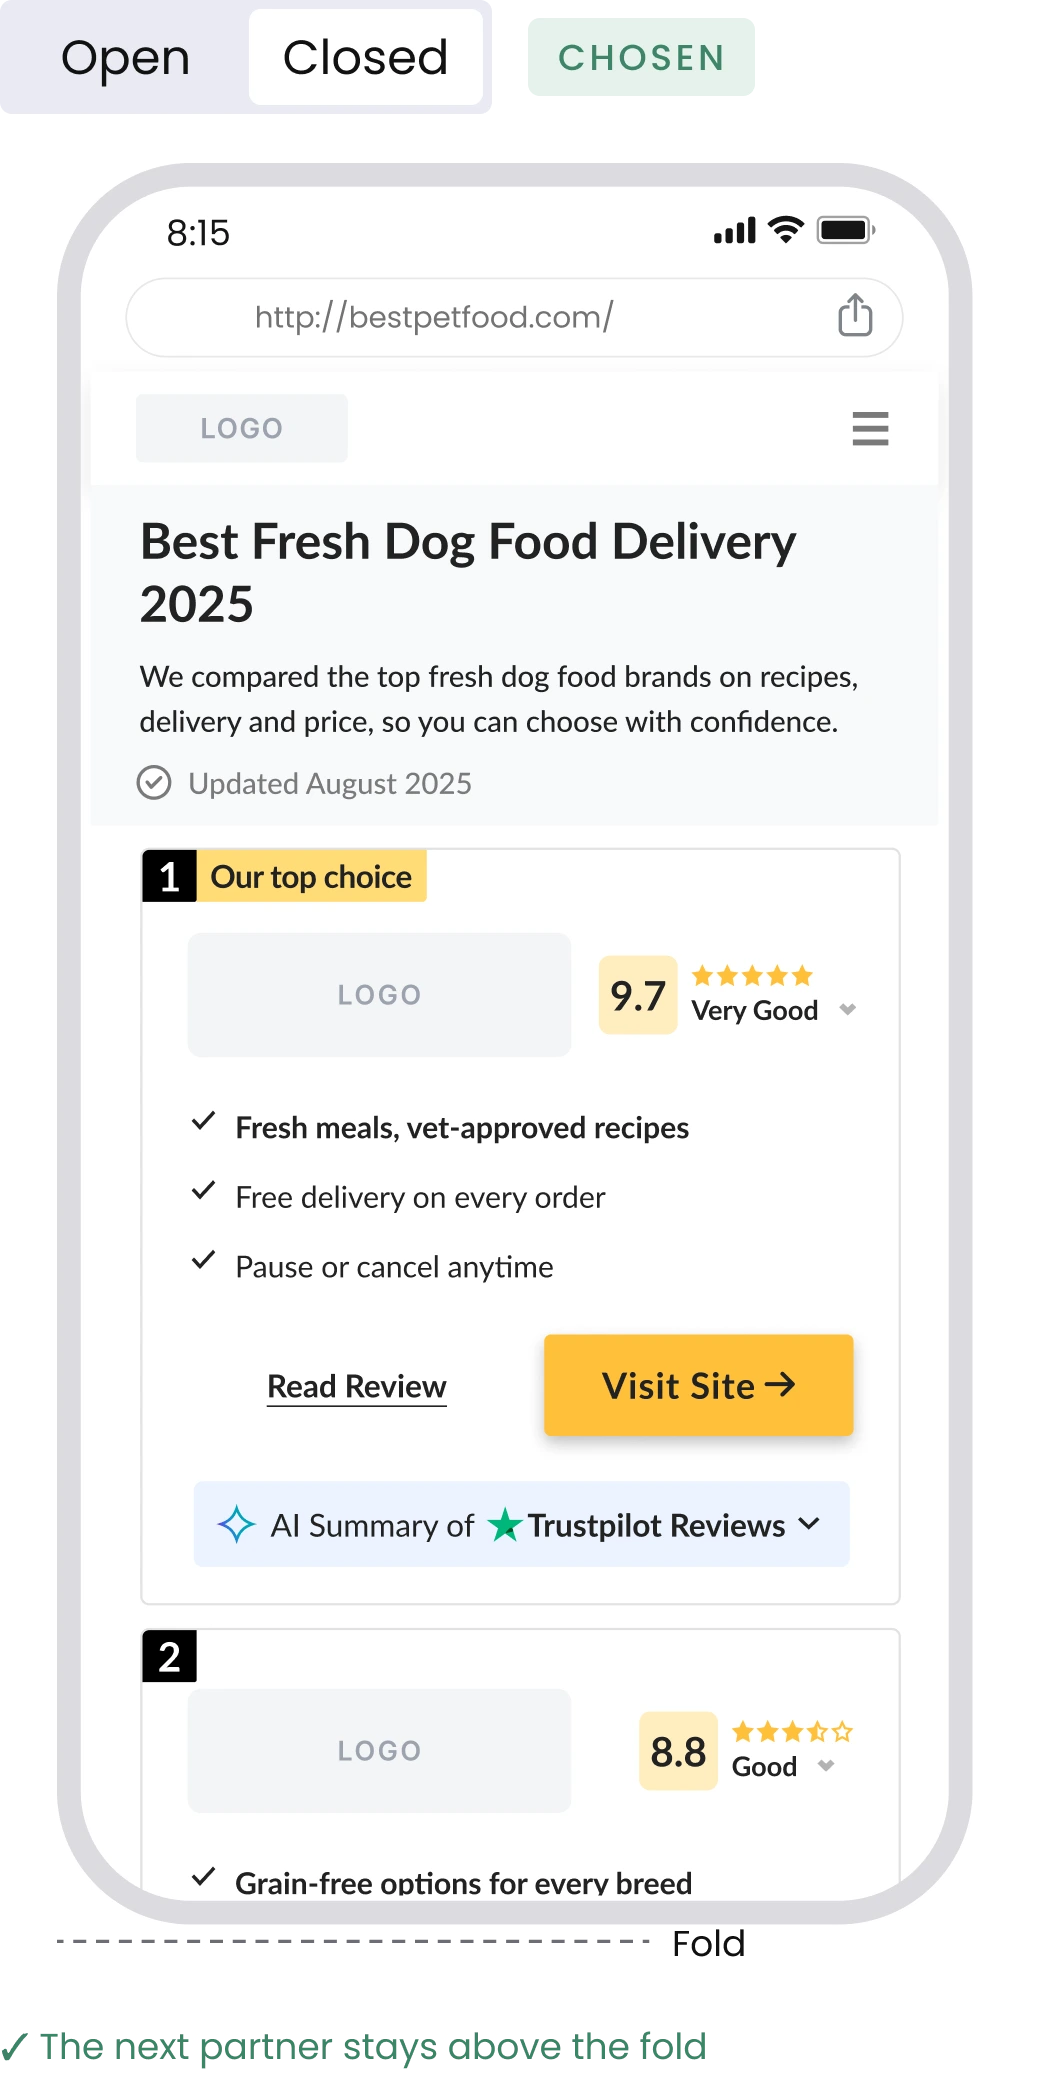
On mobile: open or closed
An open summary takes the whole mobile screen.
Open
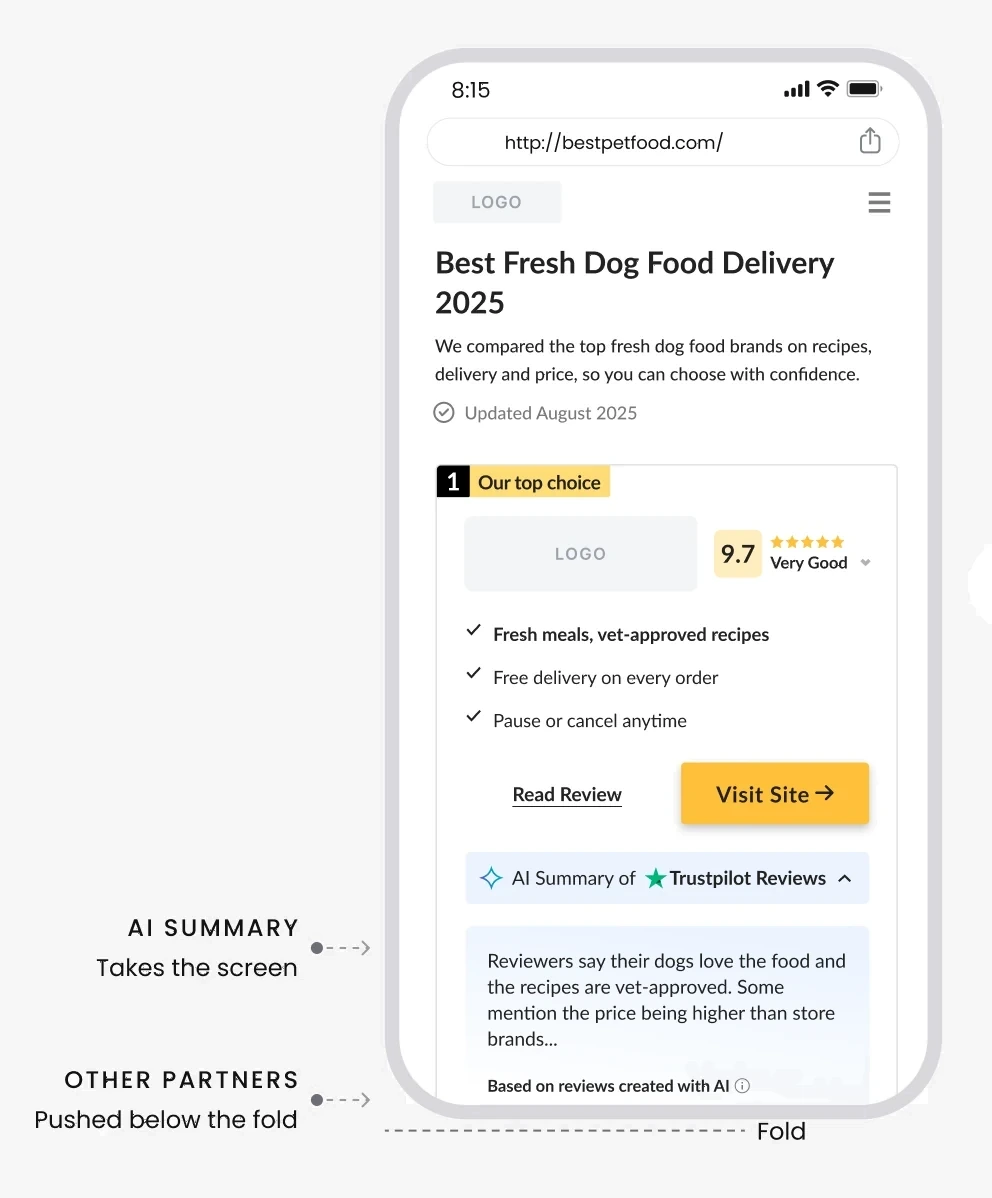
✕ Only the top partner fits above the fold
Closed
CHOSEN
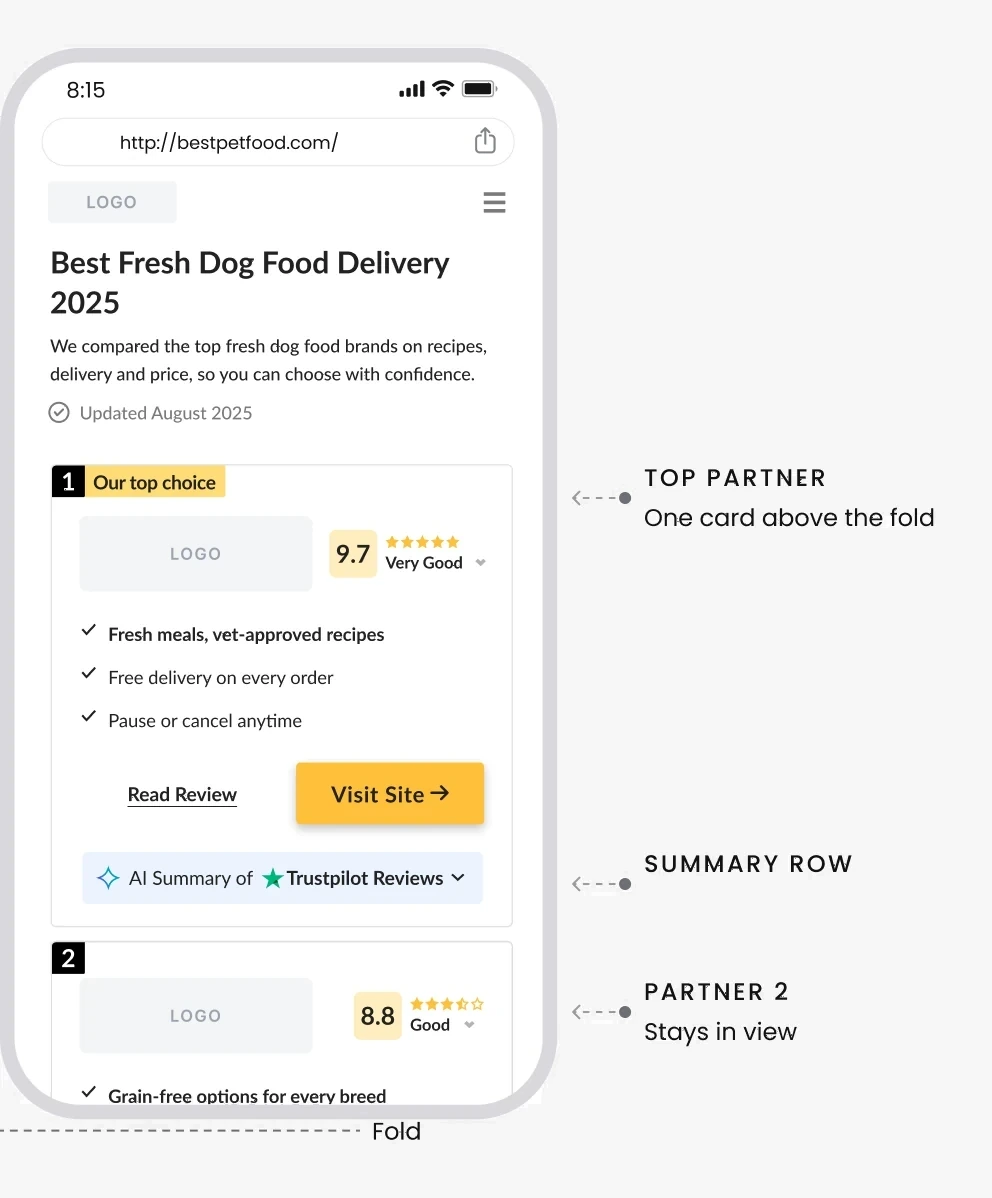
✓ The next partner stays above the fold
vs
Decision
Closed on mobile. Expanding rows had outperformed in past tests on our other verticals.
trade-off
Lower summary visibility, in exchange for keeping partner 2 above the fold.
Final design
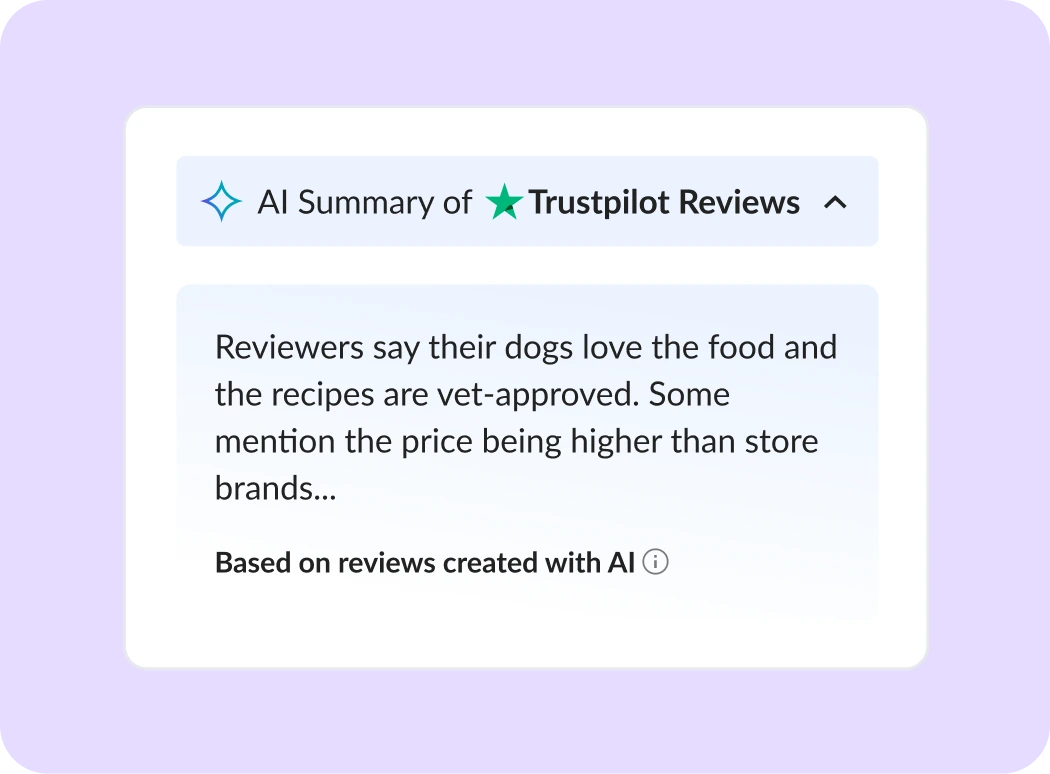
Built from the card’s existing row and components, with every state and content limit specified for content and engineering.
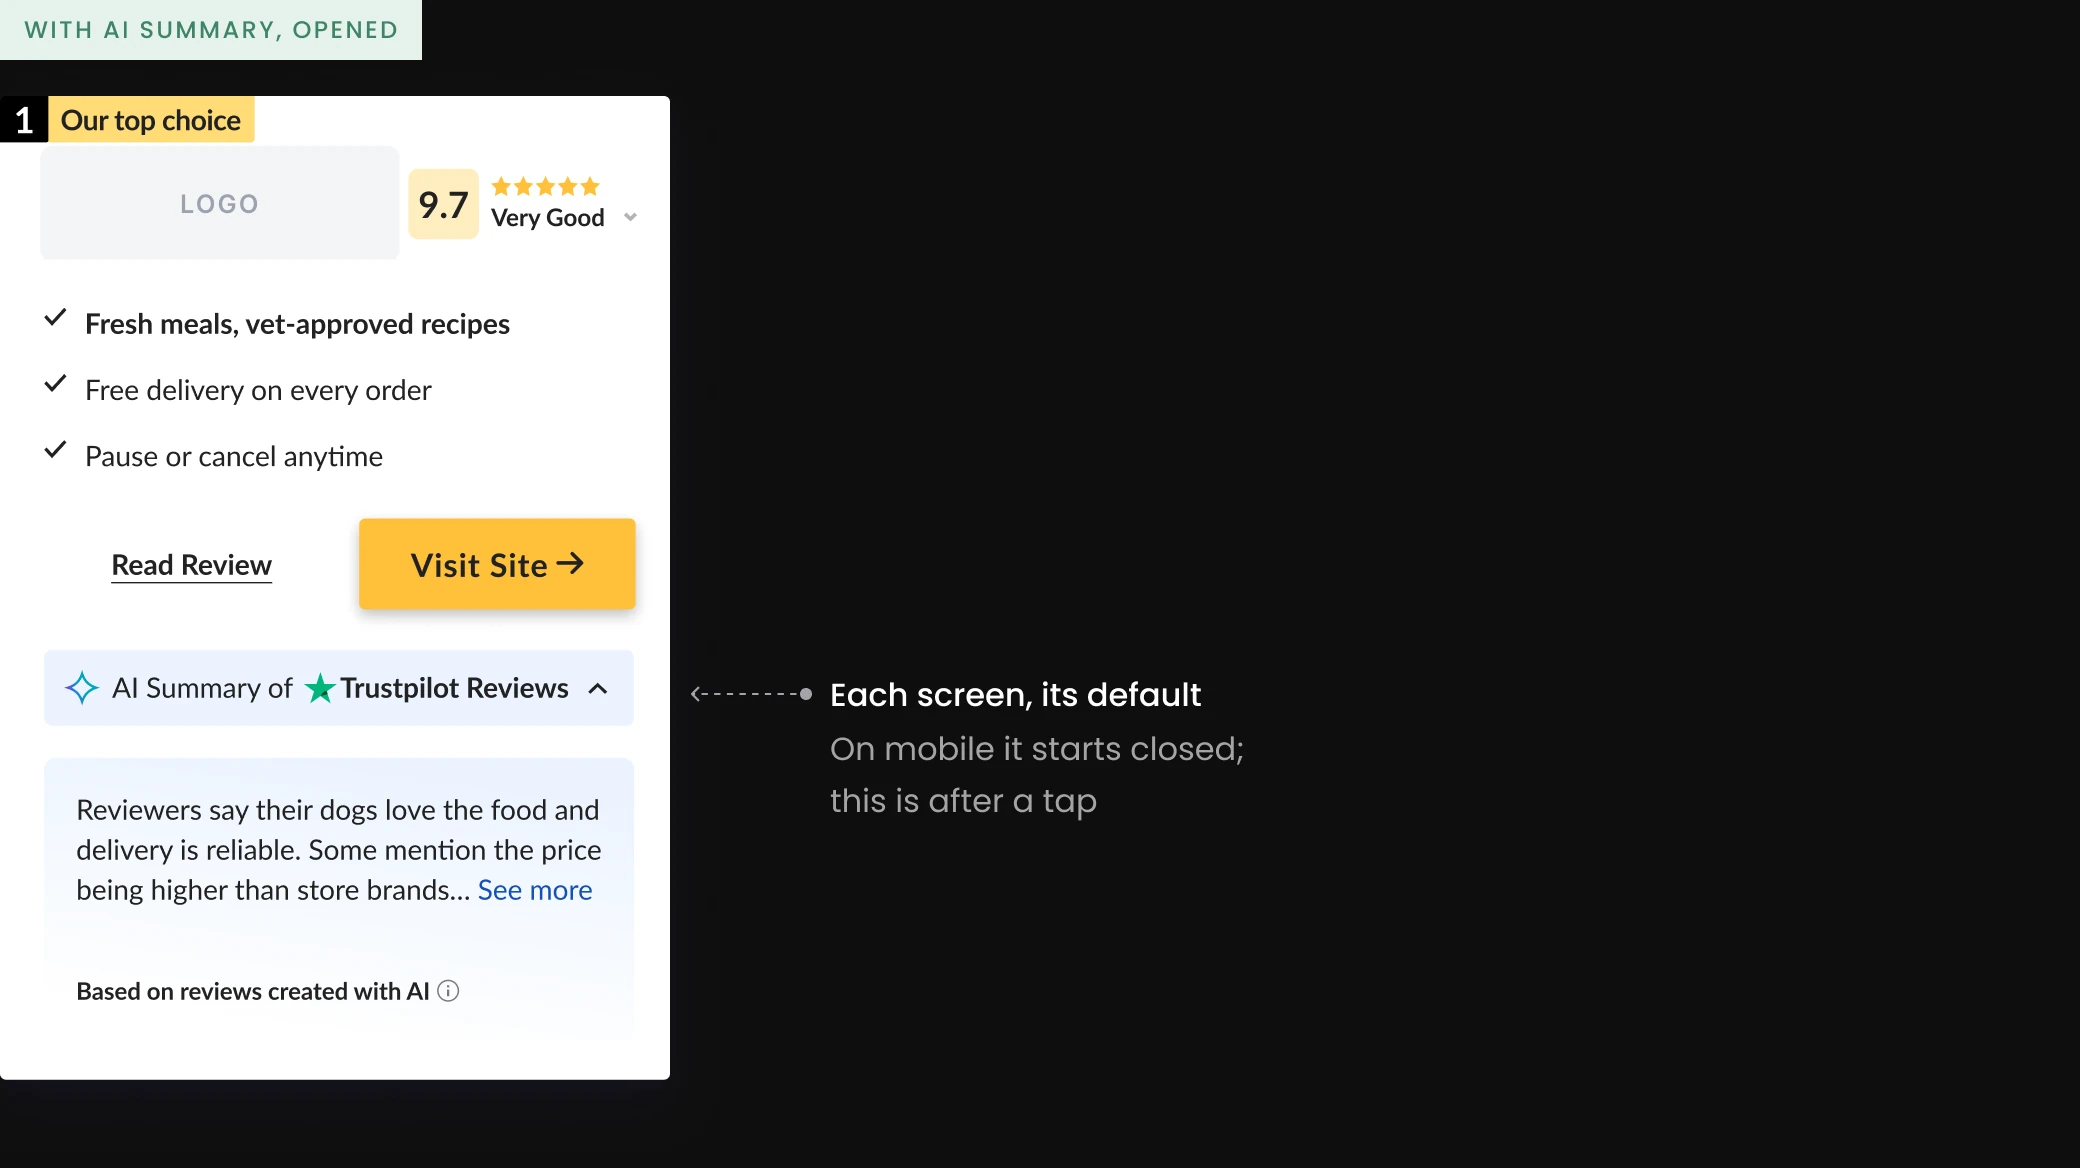
Specs
Mobile
Preview up to 187 characters, full summary up to 379.
Desktop
Summary up to 416 characters, each review up to 307.
States
Closed, open with “See more”, open with “See less”.
Beyond pet food
Built as one component in our shared design system, so any new vertical, on Cappsool or Better Impression, needs only theme tokens and summary content.
Outcome
The design was ready for handoff, but repeated scope changes and a full test queue kept it from reaching its A/B test.
In demand
Product managers across Natural Intelligence asked to bring it to their own products.
The intended journey

What I learned
Design mobile-first
Most traffic was mobile, yet we designed desktop-first. Starting with mobile would have shown earlier what had to fit above the fold.
Agree on scope early
Next time I’d agree with the PM on a fixed scope and a test date first.
Let’s talk.
Open to senior product design roles. Based in Tel Aviv, working in English, Hebrew and Spanish.
Earning Trust in AI Summaries
Project details
COMPANY
Cappsool
TIMEFRAME
1 month · Sep 2025
ROLE
Senior Product Designer
TEAM
PM, designer, dev
On Cappsool’s comparison sites, I led the research, design and handoff specs for an AI summary of real Trustpilot reviews on the top partner’s card, replacing a bare rating with real customer sentiment, without compromising the business model.
Result: A handoff-ready design for desktop and mobile. It didn’t reach its A/B test: shifting priorities and repeated scope changes kept deprioritizing it.
The problem
Our top partner underperformed on conversion in pet food, a category where buyers rely heavily on reviews. The card offered only a Trustpilot badge: users clicked through, but few converted into leads.
The business signal

01
Visit the ranking
Users compare providers

02
Click the top partner
Our most valuable partner
Users drop off here

03
Convert
Low conversion rate
A lead or sale on the partner’s site
Why pet food buyers dropped off · our hypothesis
01
Users left to research elsewhere
Trustpilot, Reddit and AI tools gave pet owners real opinions in seconds.
02
A number, not a reason to trust
Our card showed a score and a count, not the voice of the customer.
The card today
The brief
One scannable overview of what customers say, on the top partner’s card: overall sentiment, recurring themes and the general impression.
Design goals
Real sentiment, fair ranking
1
2
3
AI text people trust
✦ Based on reviews created with AI
Few card changes
AI Summary of ★ Reviews ⌃
The challenge
Add AI that builds trust, without losing what drives clicks to our partners.
Real reviews wouldn’t always support our ranking.
User trust
and
Business model
Research
User testing on our comparison sites and a review of Gemini, Booking.com and Trustpilot pointed to one principle: people trust real users most.
Benchmark examples
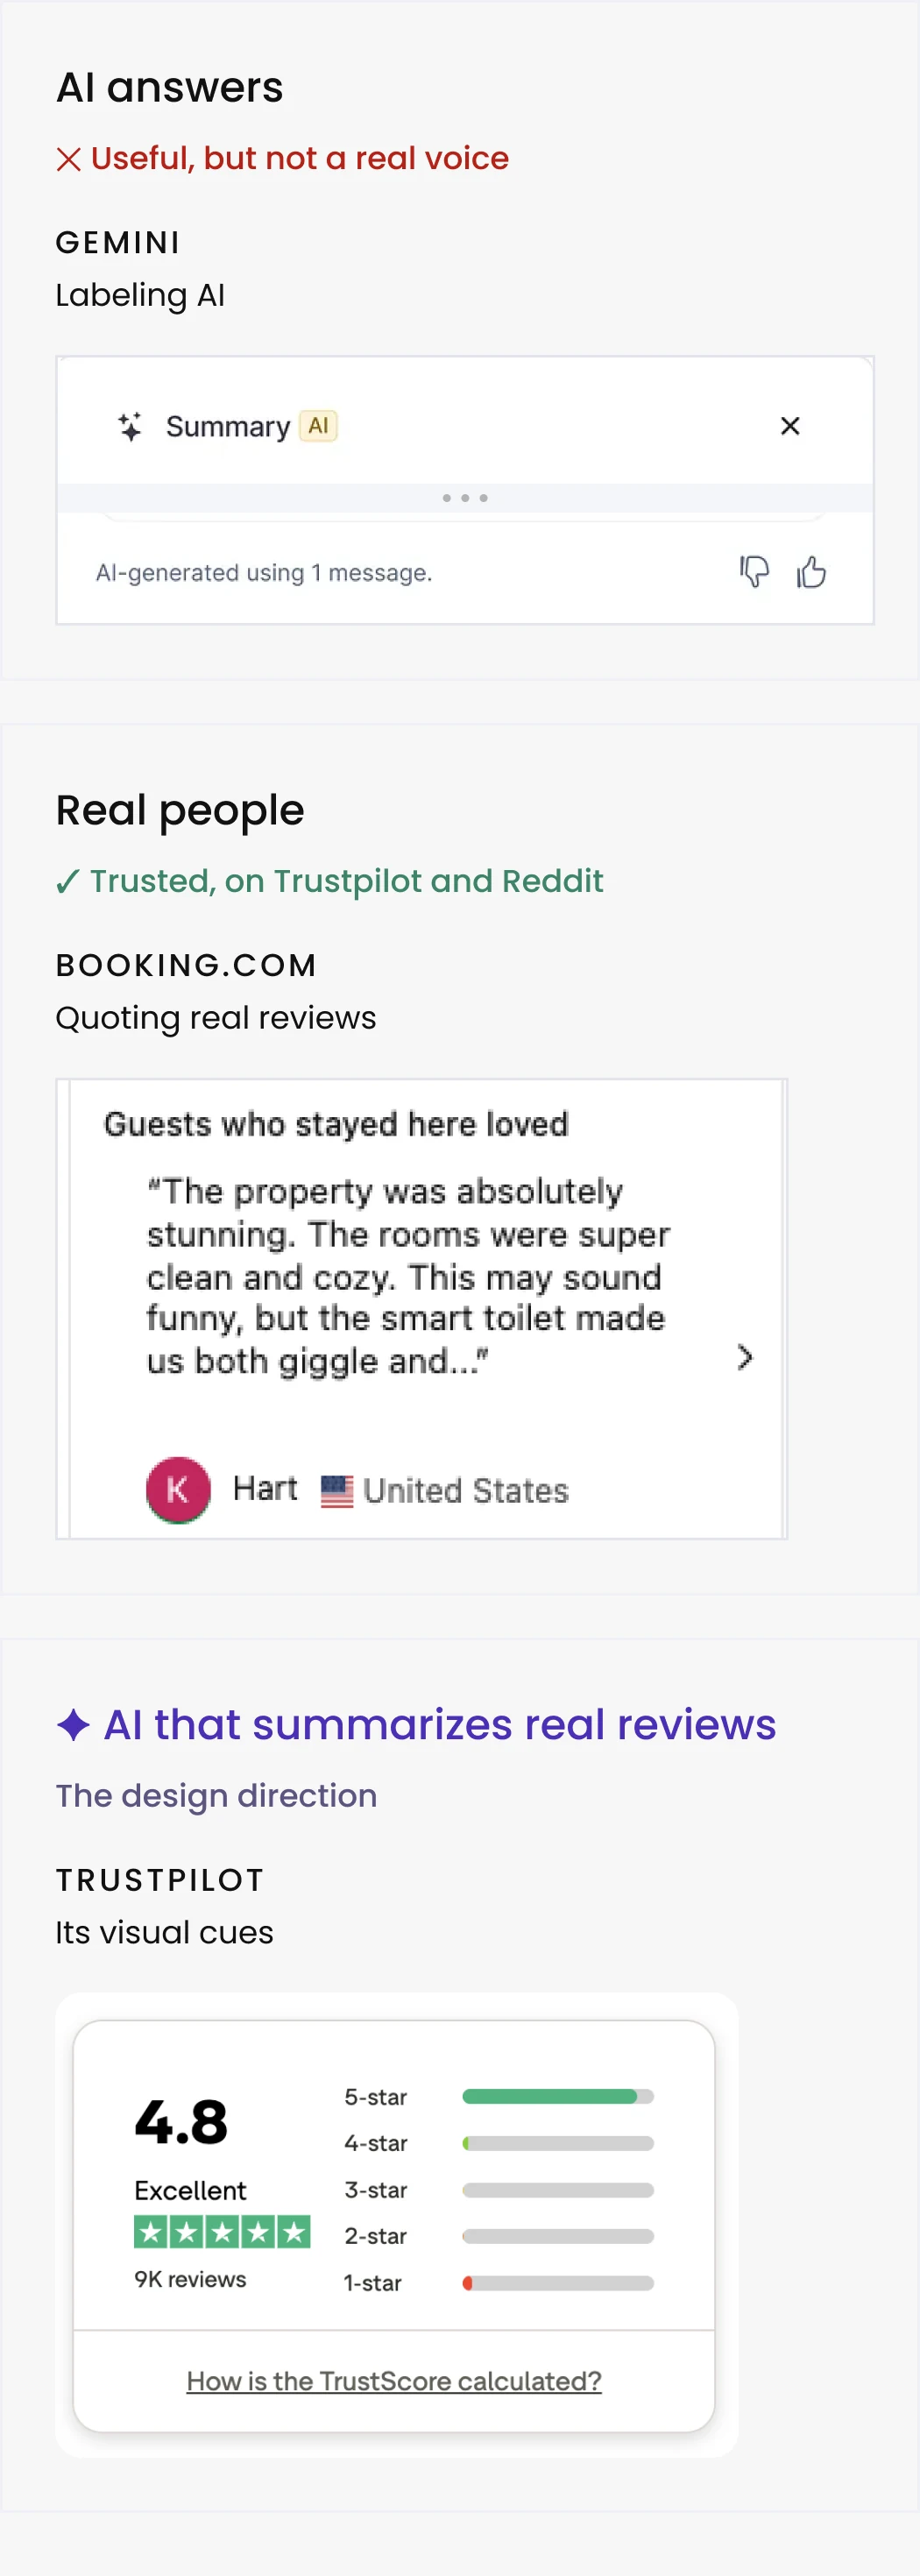
Explorations
I started with a side overlay, then moved the summary into the card and explored two review patterns: a rating breakdown and quoted reviews.
Iteration 3
CHOSEN
Summary + review carousel on the side
The Trustpilot API lets us filter which reviews appear, but not the rating distribution.
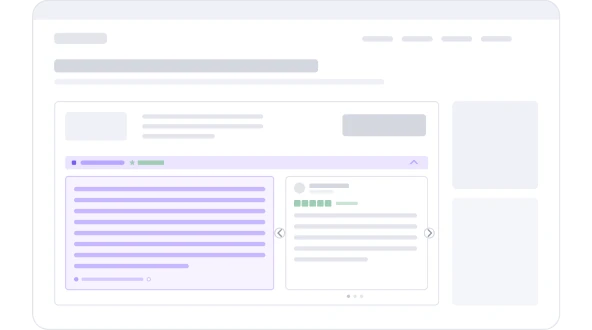
✓ A real review, with name and stars
Positive quotes add a human voice.
Iteration 1
Side overlay
A link on the card opened a panel from the right, with the AI summary and real reviews.
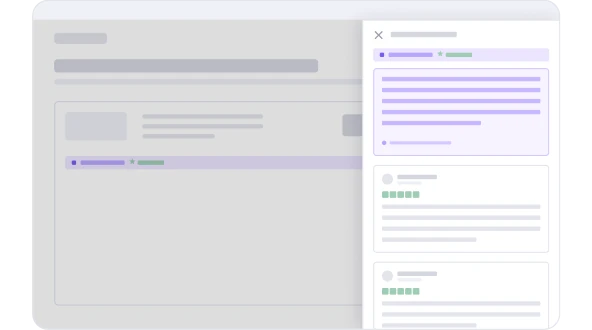
✕ Pulled users off the card, away from the CTA
Iteration 2
Summary + ratings on the side
A full breakdown exposes every rating, so red 1–2★ bars would sit right next to the CTA.
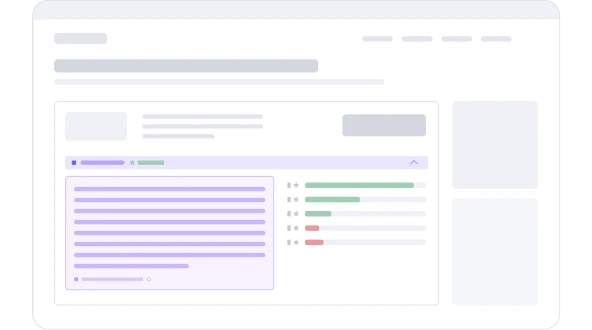
✕ Red 1–2★ bars beside the summary
Outcome
Desktop: open by default, with real reviews beside it. The quotes are filtered to positive ones, a trade-off between transparency and conversion, so the AI label and Trustpilot source stay visible.
Decision: the card
With the carousel chosen, the first decision was what the card shows.
On the card: rating line or no rating line
Iteration 4 swapped the breakdown for a single rating line.
Decision
No rating line on either screen. The labeled summary carries the message.
trade-off
Less detail at a glance, but nothing on the card works against the click. The partner’s score is already on the card.
Decision: mobile default
With the card settled, the last decision was the mobile default. About 70% of pet food traffic was mobile (Google Analytics), where the desktop pattern took too much space.
On mobile: open or closed
An open summary takes the whole mobile screen.
Decision
Closed on mobile. Expanding rows had outperformed in past tests on our other verticals.
trade-off
Lower summary visibility, in exchange for keeping partner 2 above the fold.
Final design
Built from the card’s existing row and components, with every state and content limit specified.
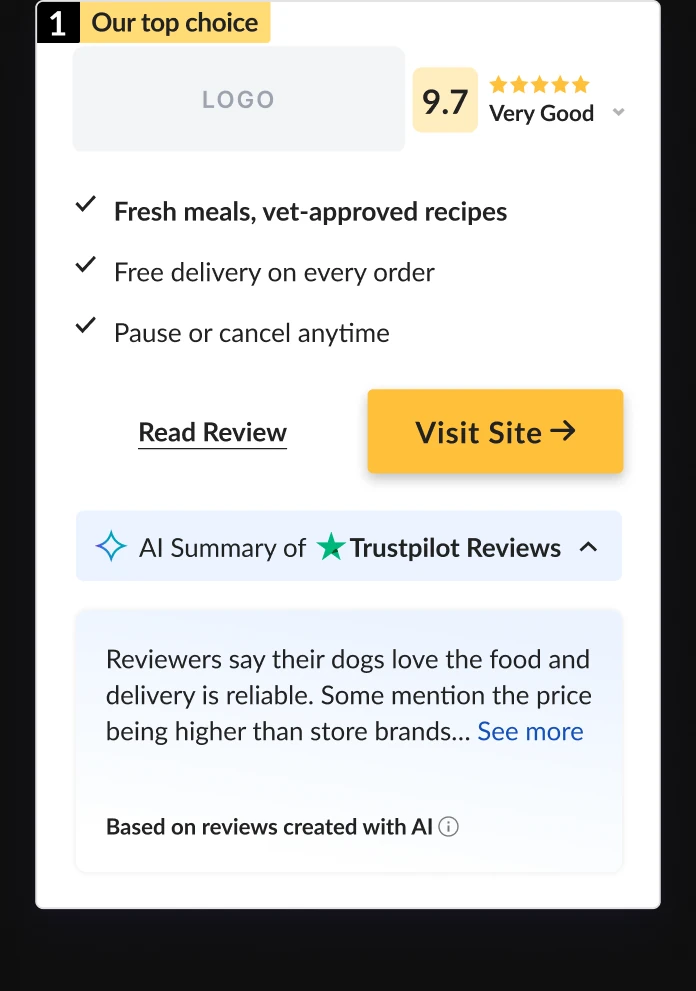
Each screen, its default
On mobile it starts closed; this is after a tap
Beyond pet food
One shared design-system component: a new vertical needs only theme tokens and summary content.
Outcome
The design was ready for handoff, but repeated scope changes and a full test queue kept it from reaching its A/B test.
In demand
Product managers across Natural Intelligence asked to bring it to their own products.
What I learned
01
Design mobile-first
Most traffic was mobile, yet we designed desktop-first. Starting with mobile would have shown earlier what had to fit above the fold.
02
Agree on scope early
Next time I’d agree with the PM on a fixed scope and a test date first.
Let’s talk.
Open to senior product design roles. Based in Tel Aviv, working in English, Hebrew and Spanish.
Helping Visitors Decide: Tabs vs. Comparison
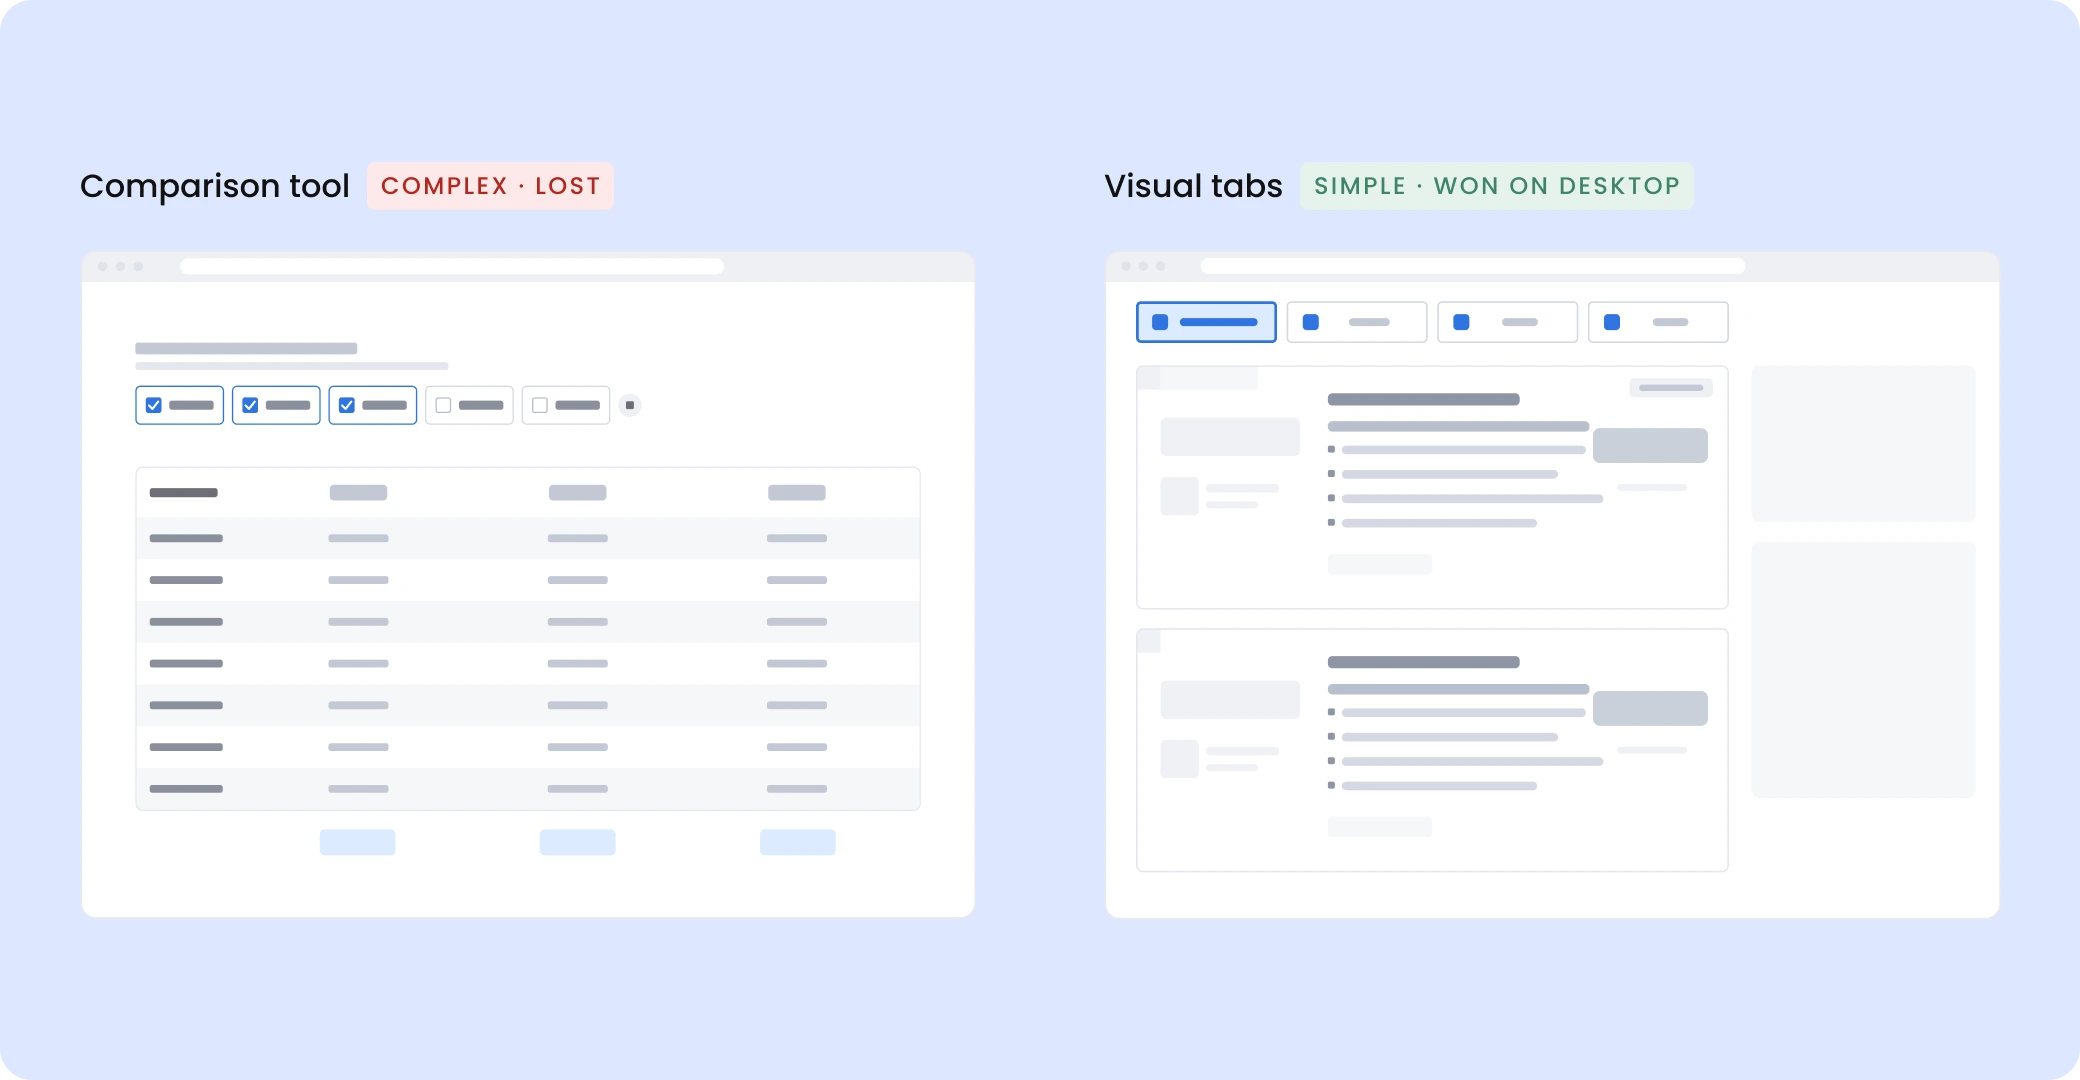
Visitors from paid and organic search land on a page ranking online banking accounts, looking for the right account, fast. I researched and designed two ways to lift revenue per visitor, an interactive comparison tool and simple visual tabs; the PM A/B tested each on its own.
Result: Won on desktop on revenue per visitor (+7.5%), conversion rate and revenue per click. Live in Online Banking and Online Degrees.
COMPANY
Cappsool
TIMEFRAME
3 weeks · Dec 2025
ROLE
Senior Product Designer
TEAM
1 PM · 1 designer · 1 developer
The problem
Visitors (B2C) wanted a fast answer. Partners (B2B) wanted their product features visible, and every card had to carry legal information.
Goal
Get visitors to the right partner, faster.
Scope
The list only. Header, layout and legal info stayed fixed.
Success
Revenue per visitor (primary), plus clicks to partners, conversion rate and revenue per click.
Research
What visitors told us, and what leading comparison sites do.
User testing
Interviews and session recordings with US participants.
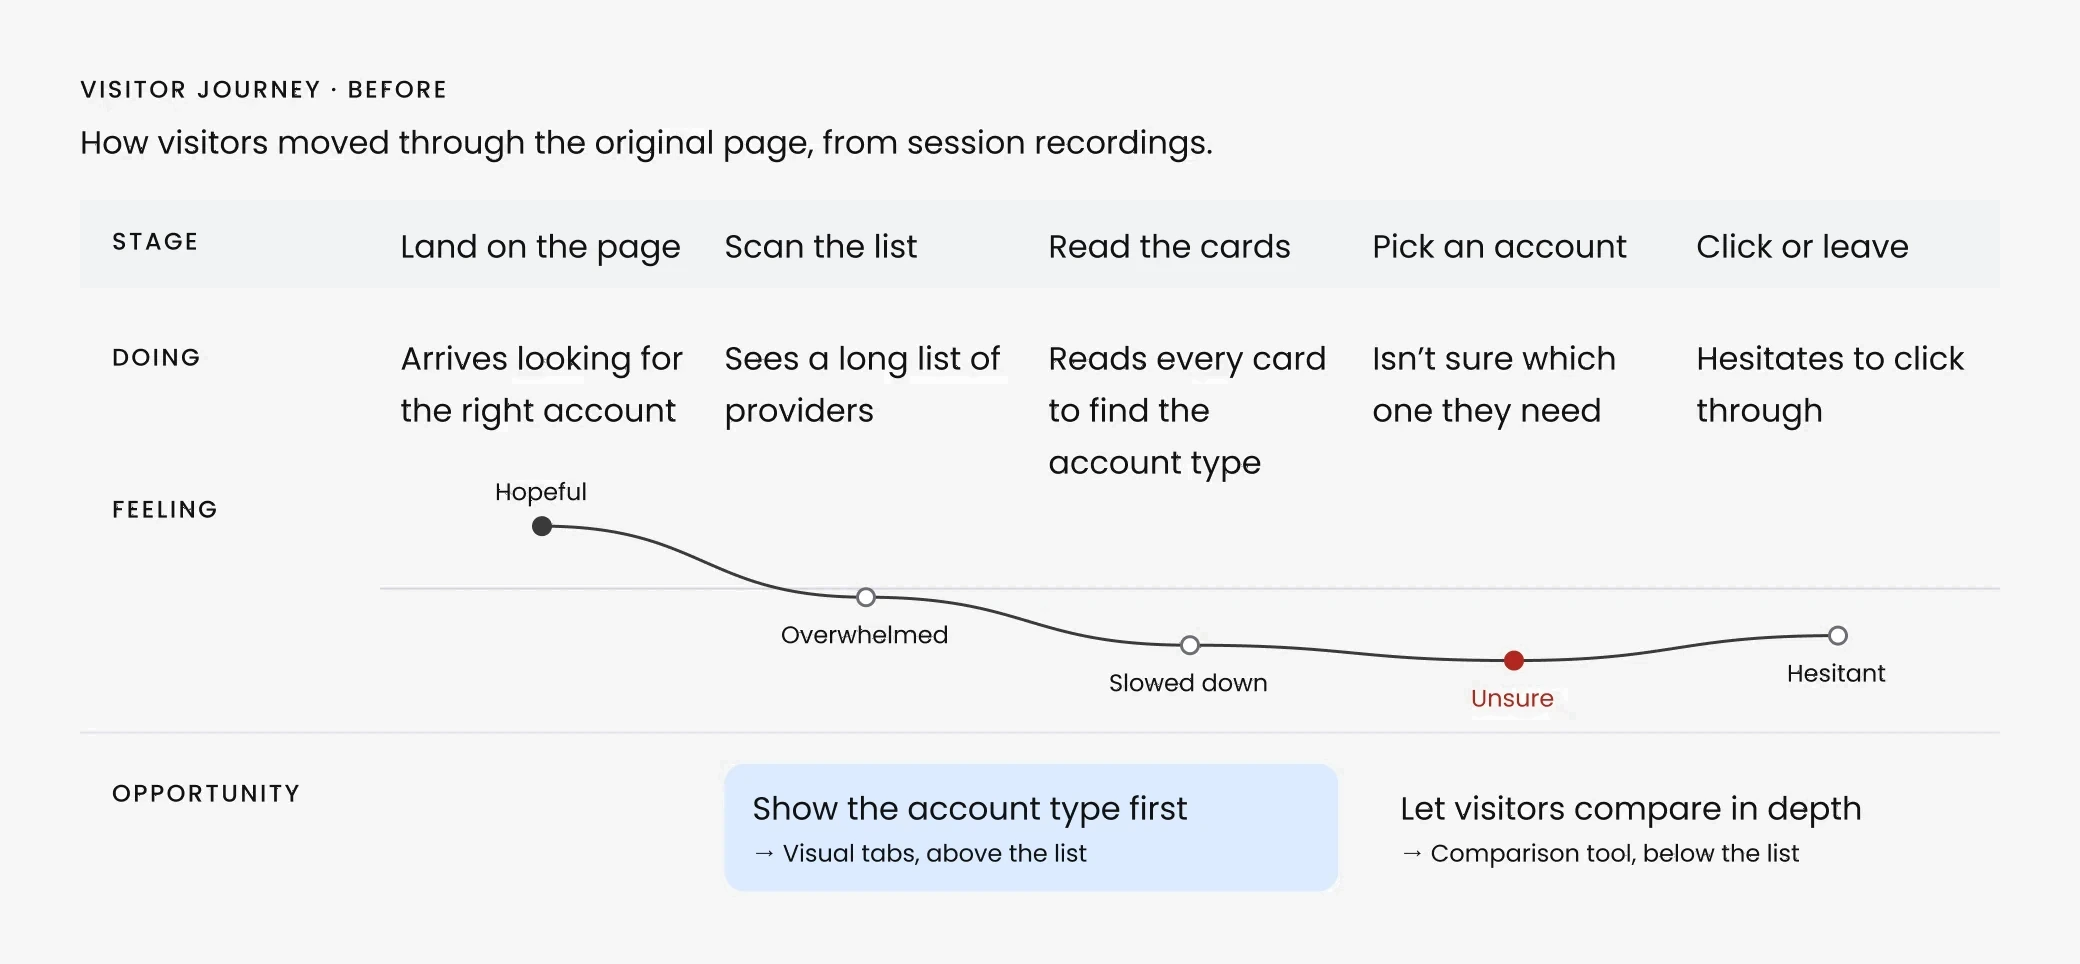
What a visitor said
“I see a lot of providers and I’m not sure which one I need. It’s clear, but it’s taking me a while to find what I’m looking for. Not sure I would purchase.”
US participant · Recorded session

What we found
It wasn’t only banking: we saw the same pattern in several industries where conversion was dropping.
Benchmark
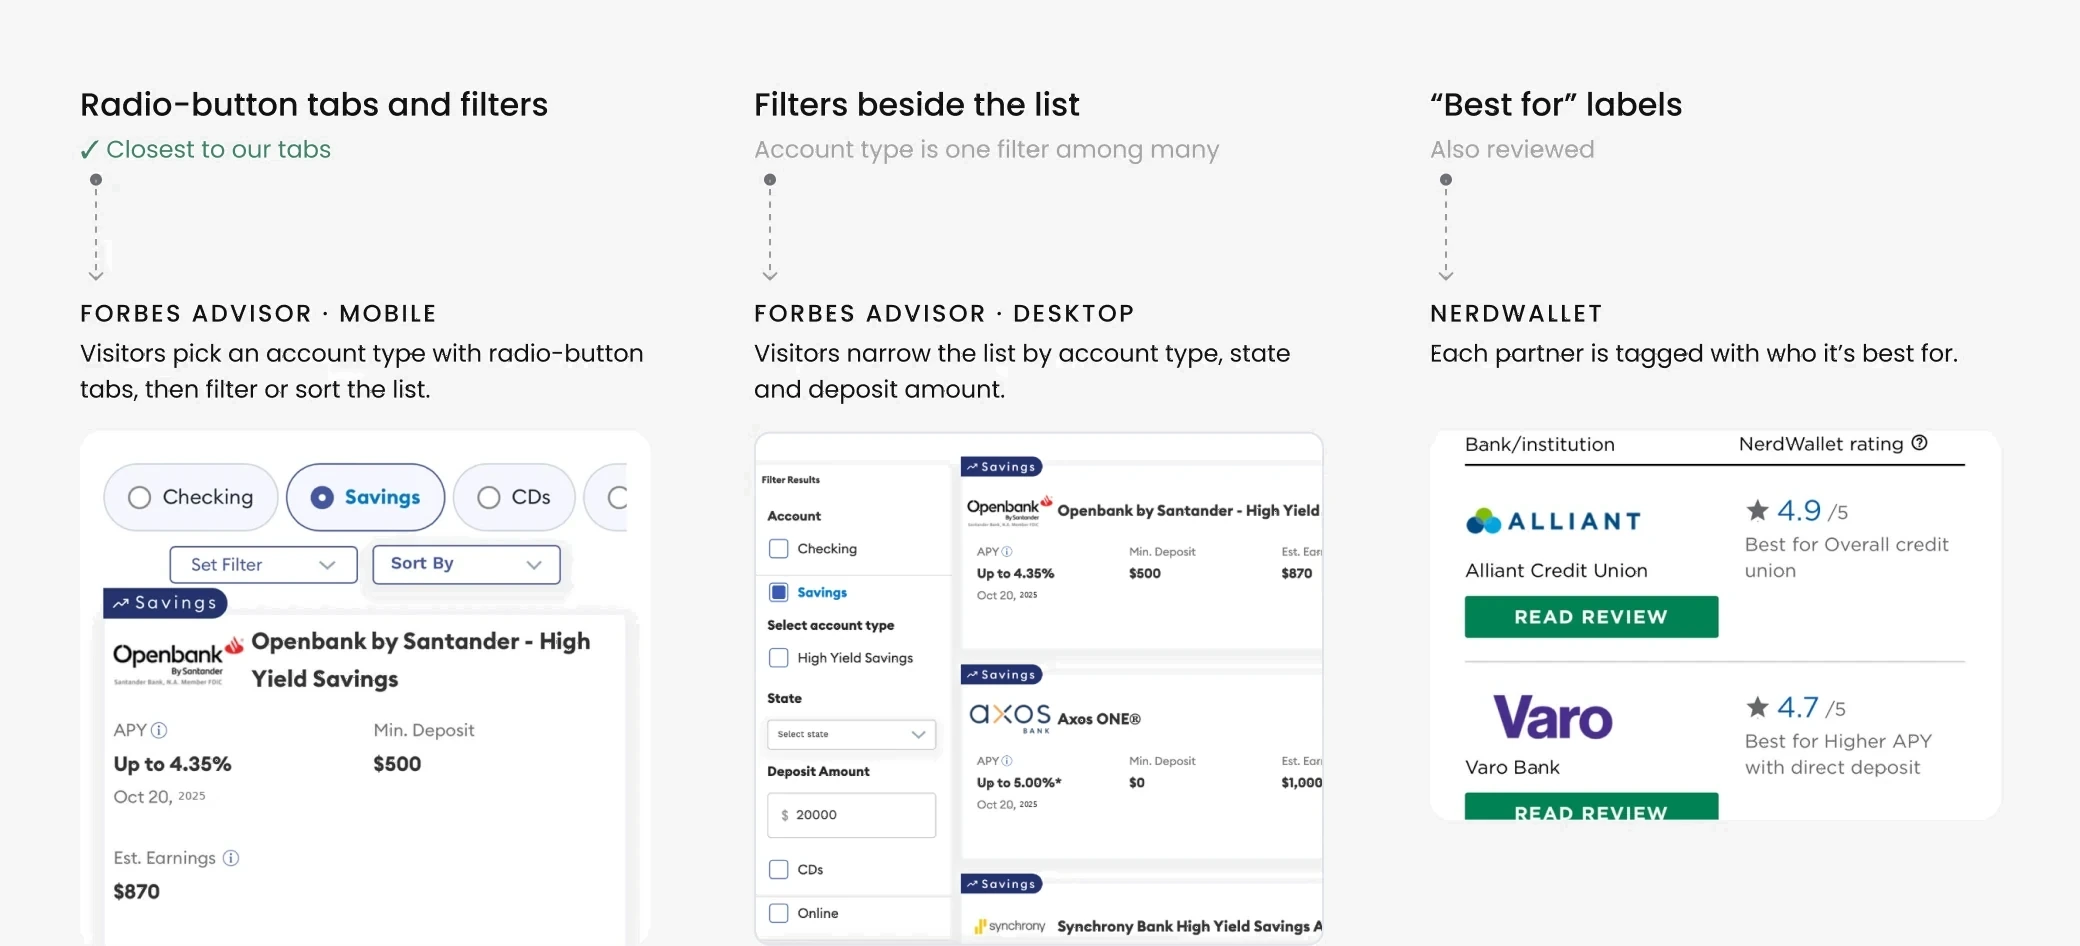
Forbes Advisor and NerdWallet.
The approach
Two solutions to the same problem: one adds a step for in-depth comparison, the other narrows the list in one tap.
Complex pattern
Comparison tool
Why
More control for the user
→
More confident choice
→
More clicks to partners
Simple pattern
Visual tabs

Why
Less to evaluate
→
Faster decision
→
More clicks and revenue
Interactions a visitor needs before reaching a partner.
4
interactions · comparison tool
1
interaction · visual tabs
Comparison tool
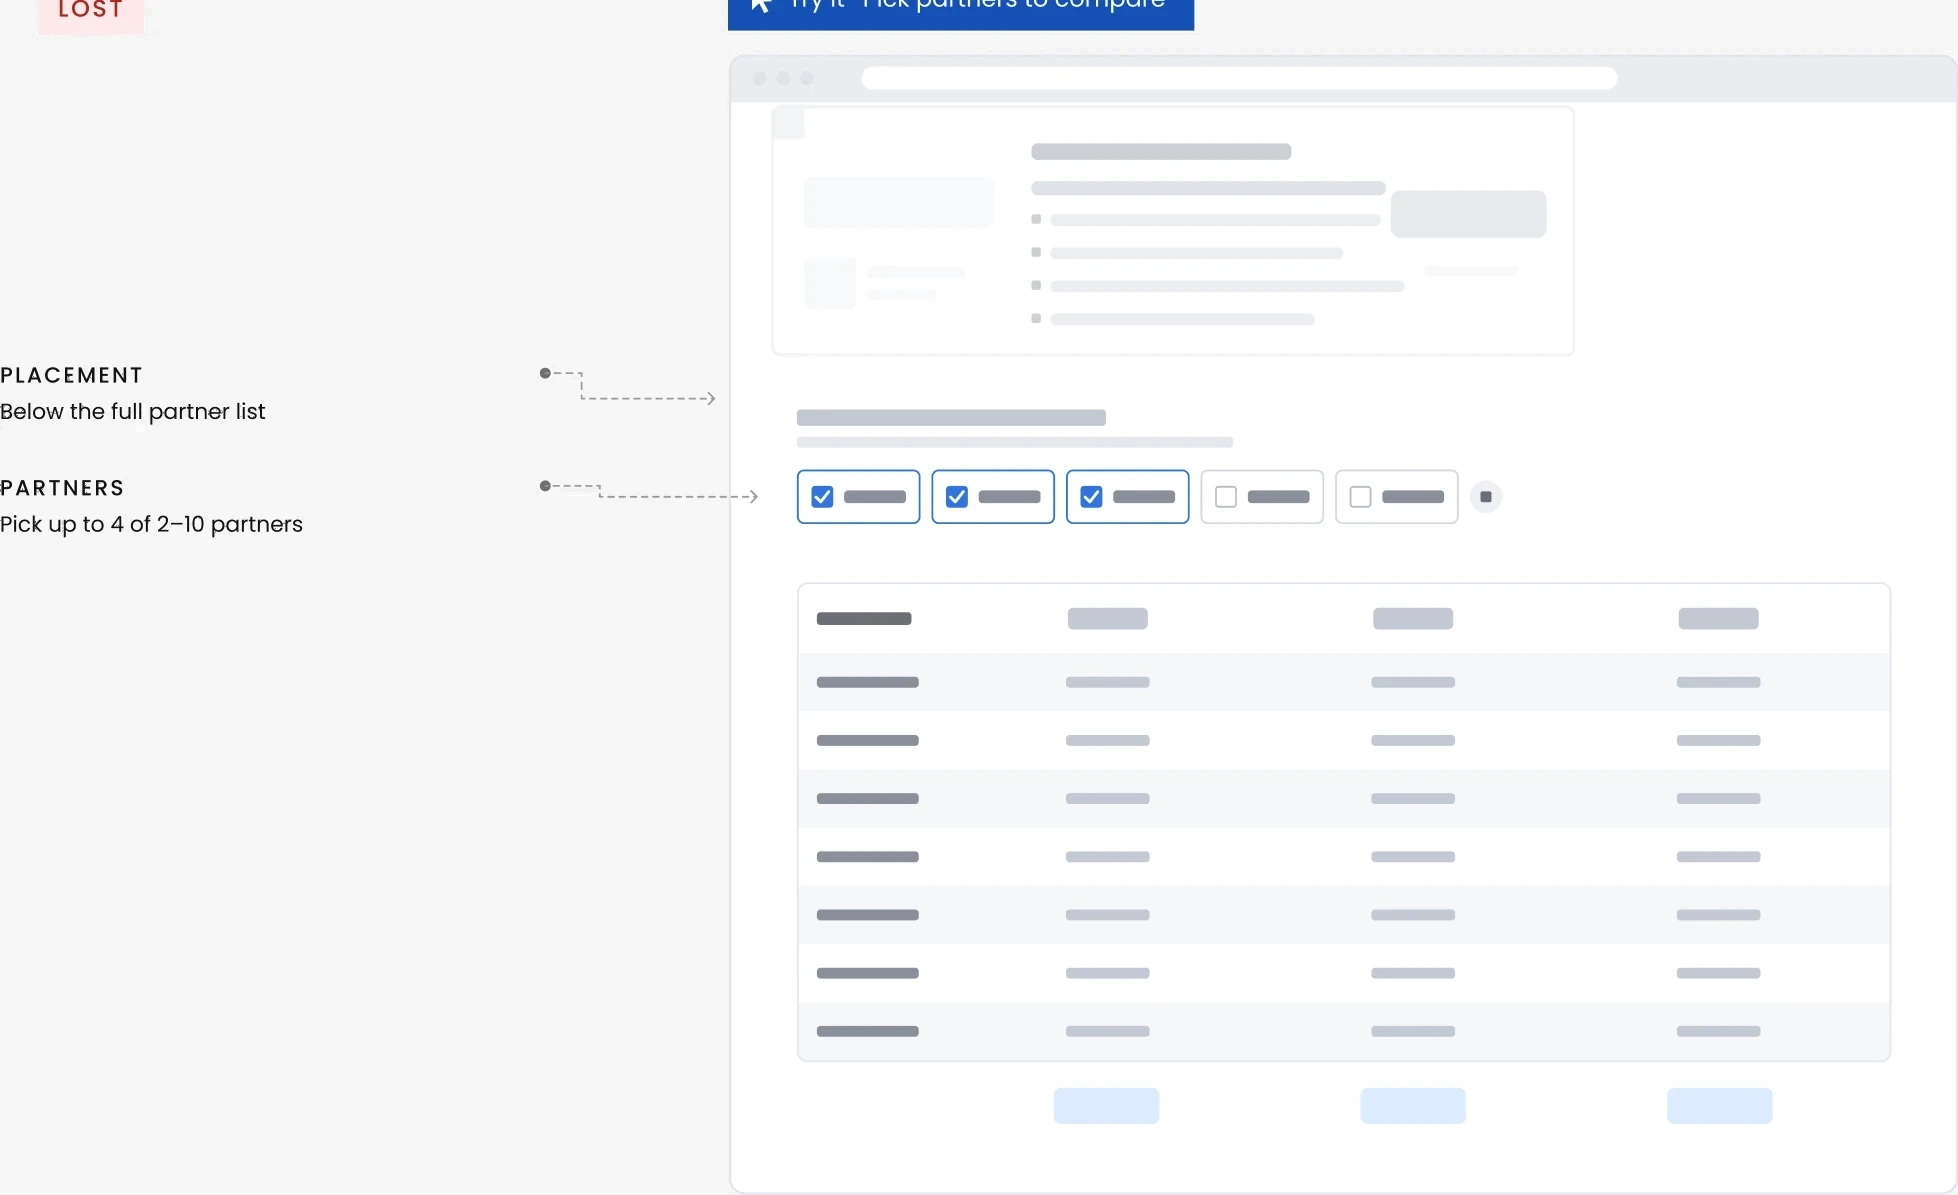
Stakeholders and partners wanted more visibility for product features, so visitors could select up to four partners, compare them feature by feature, then continue to the partner’s site.
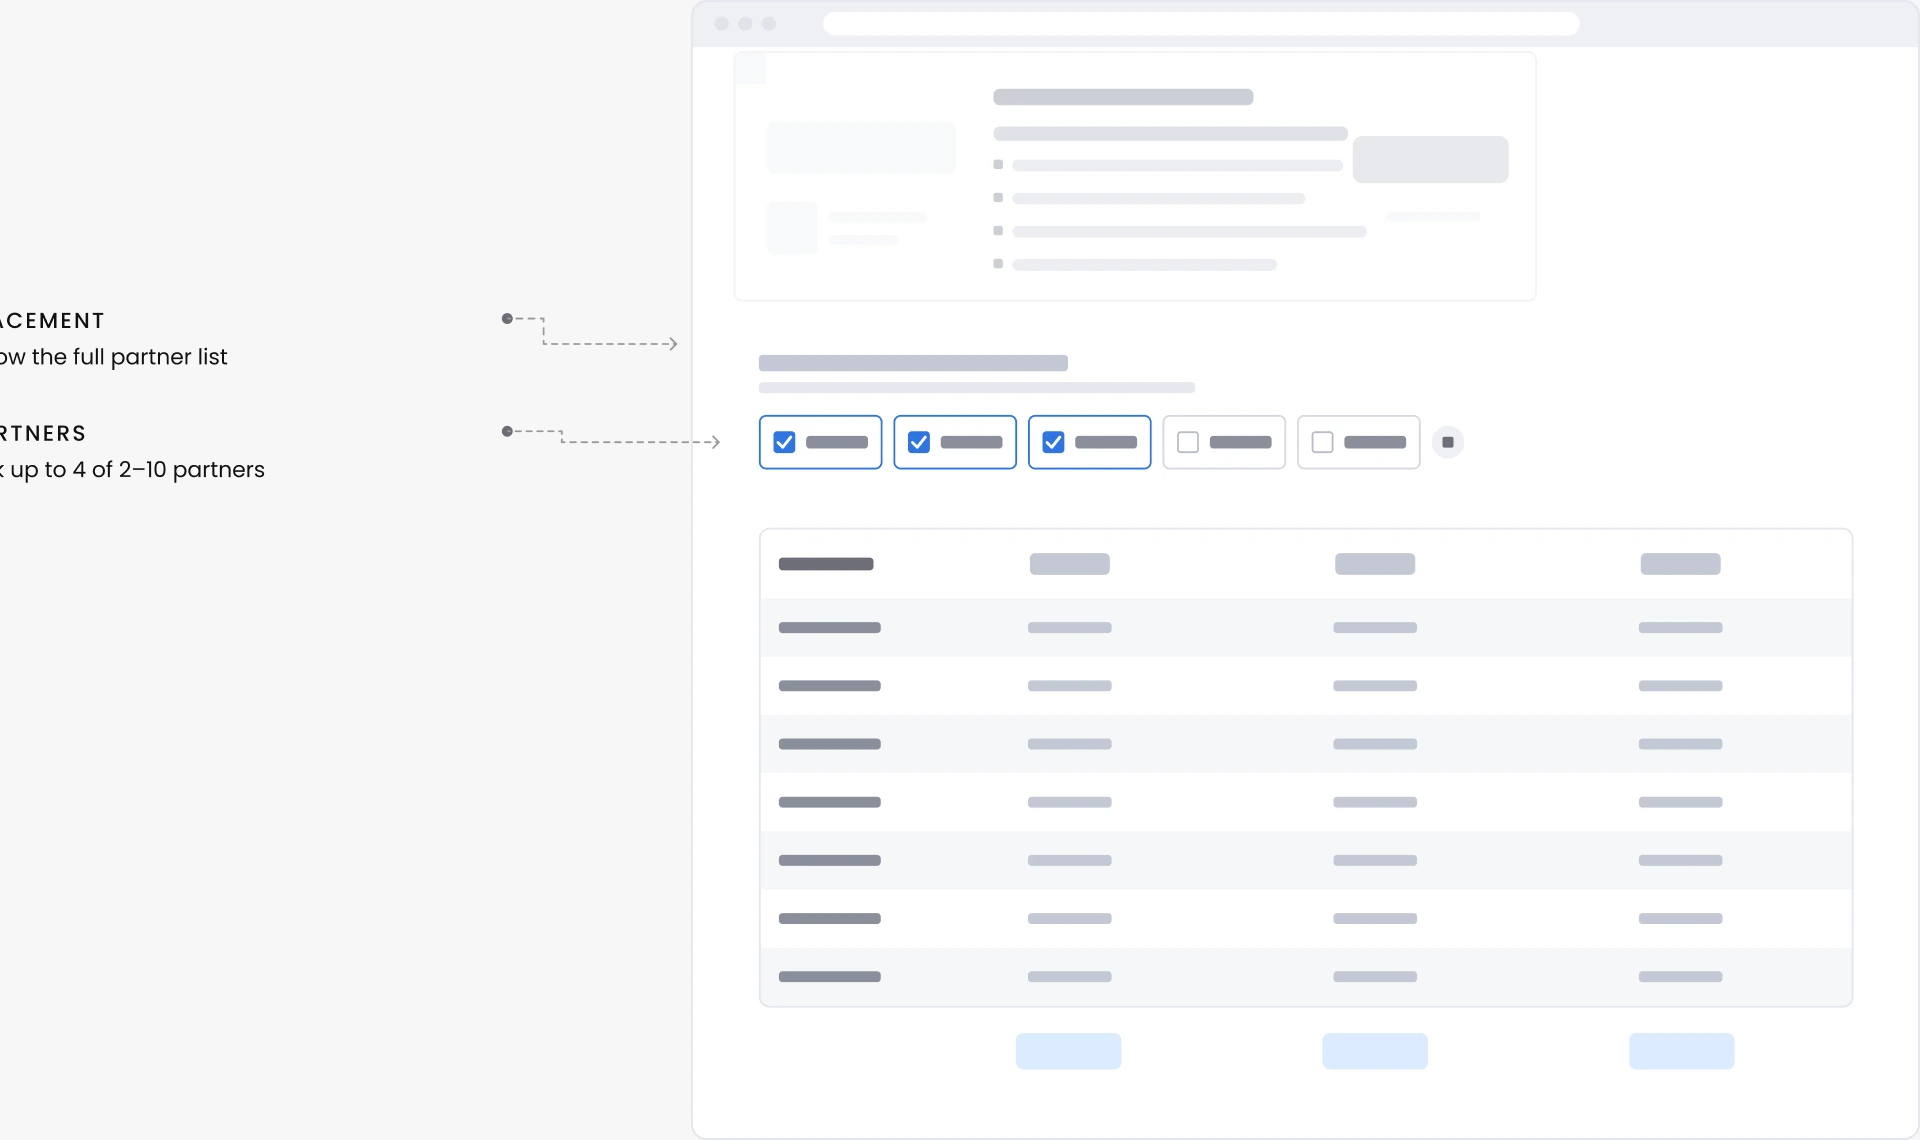
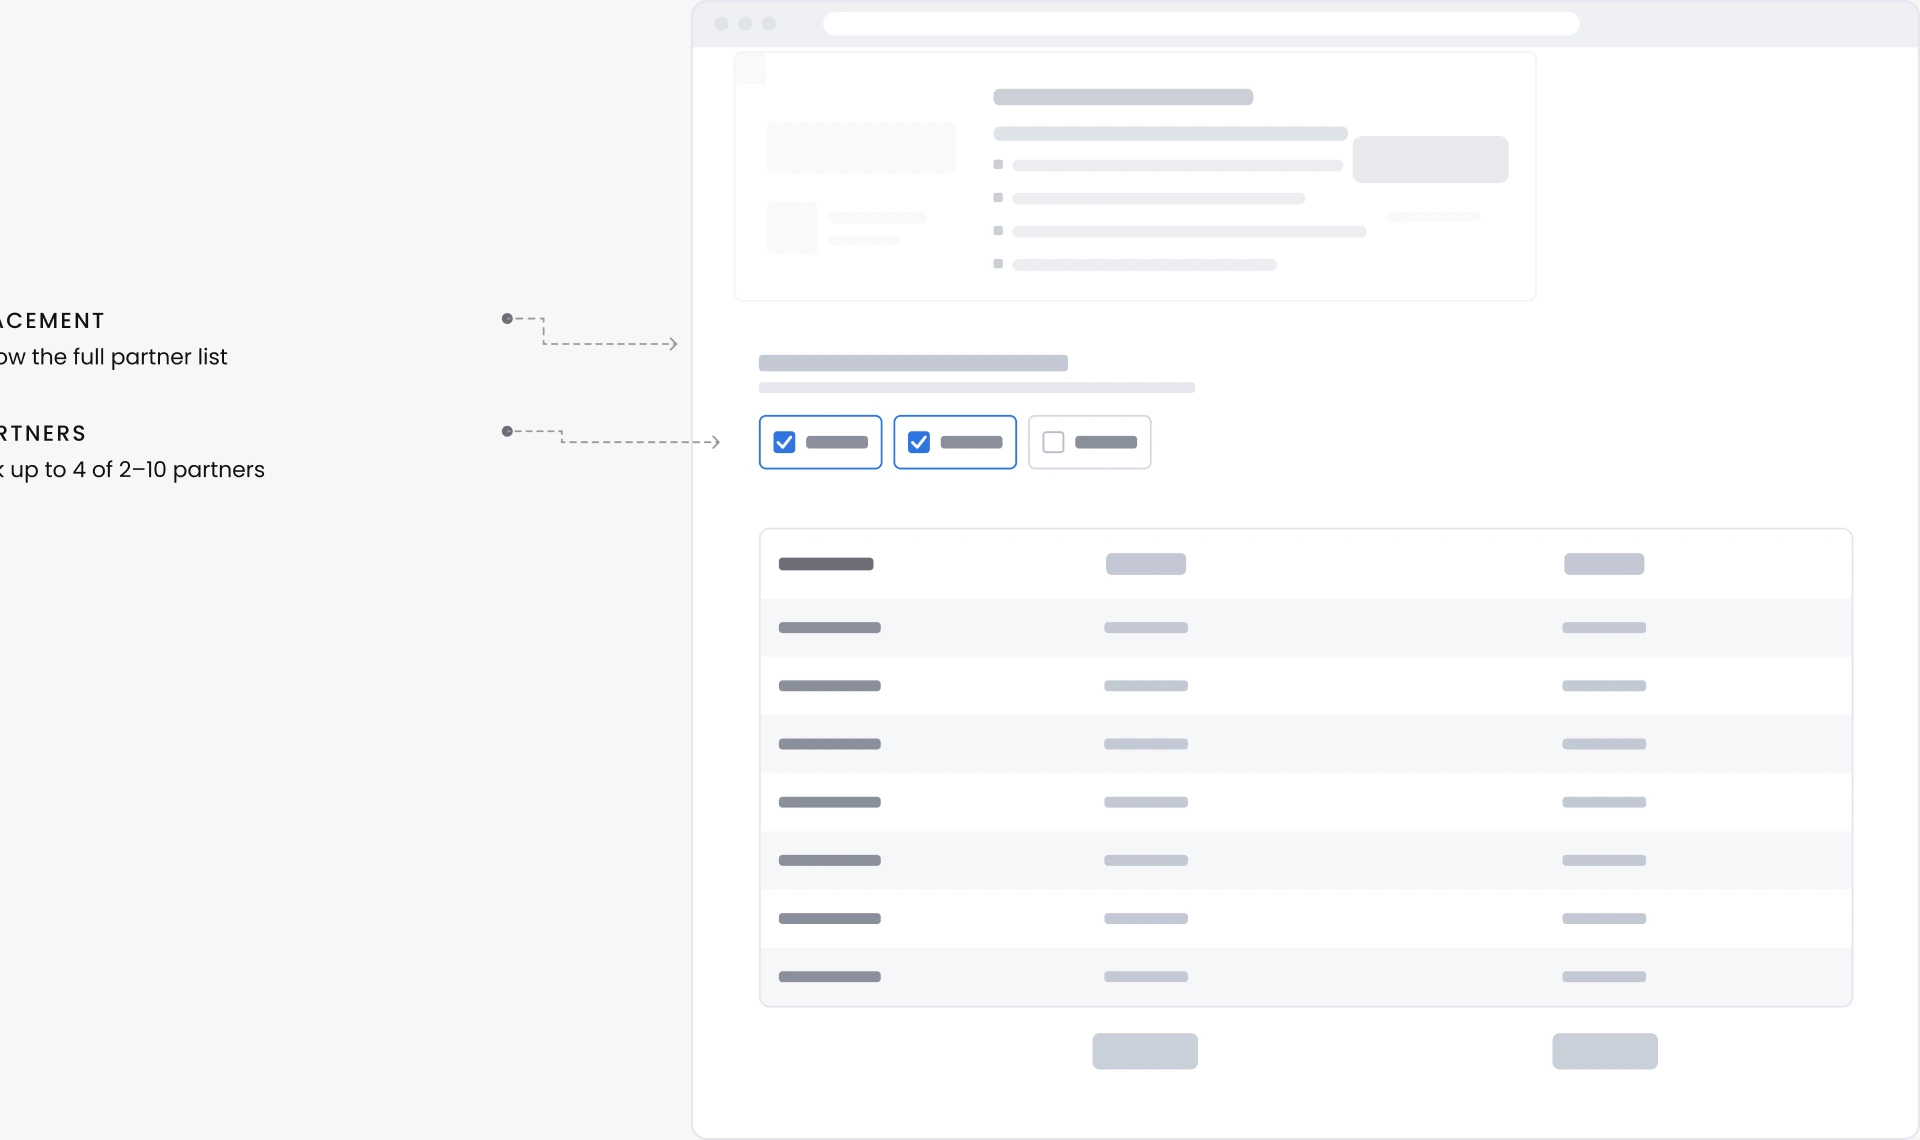
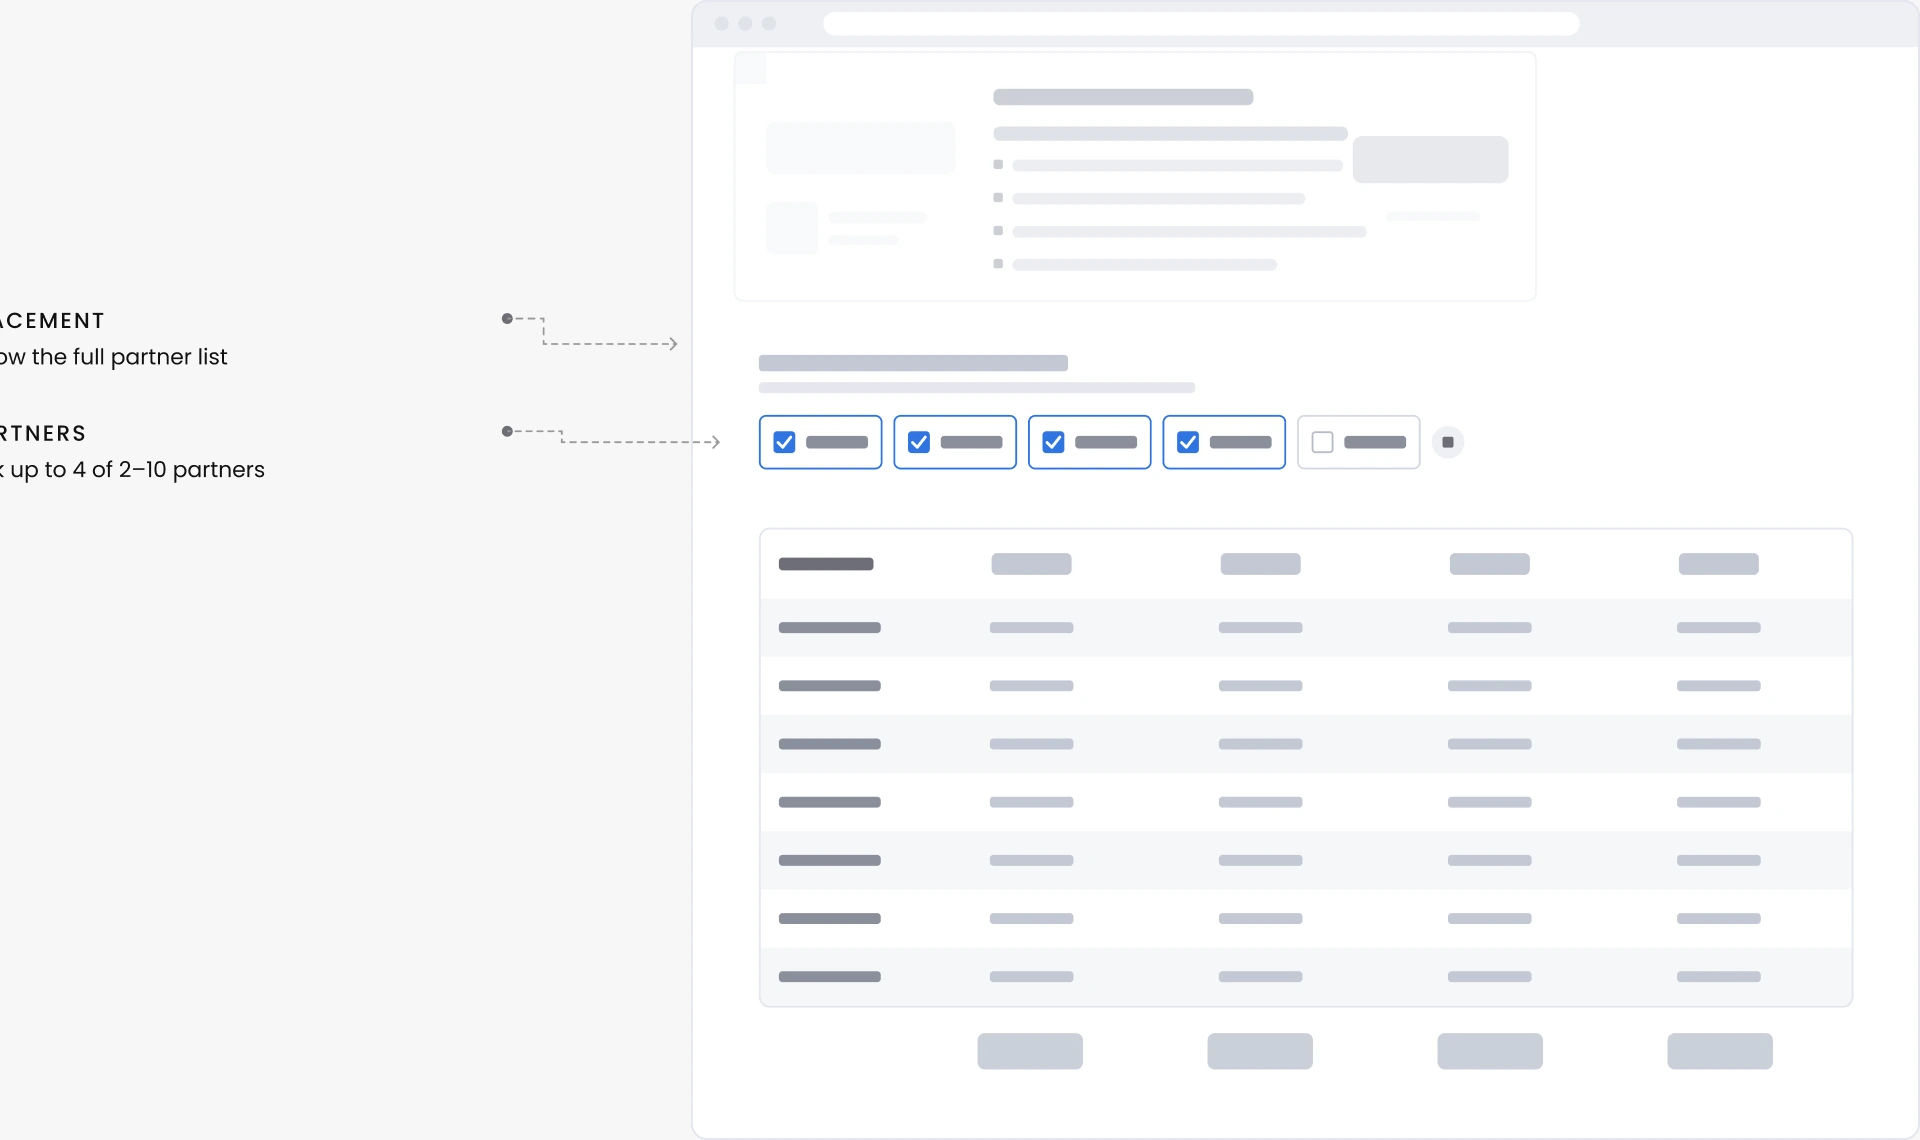
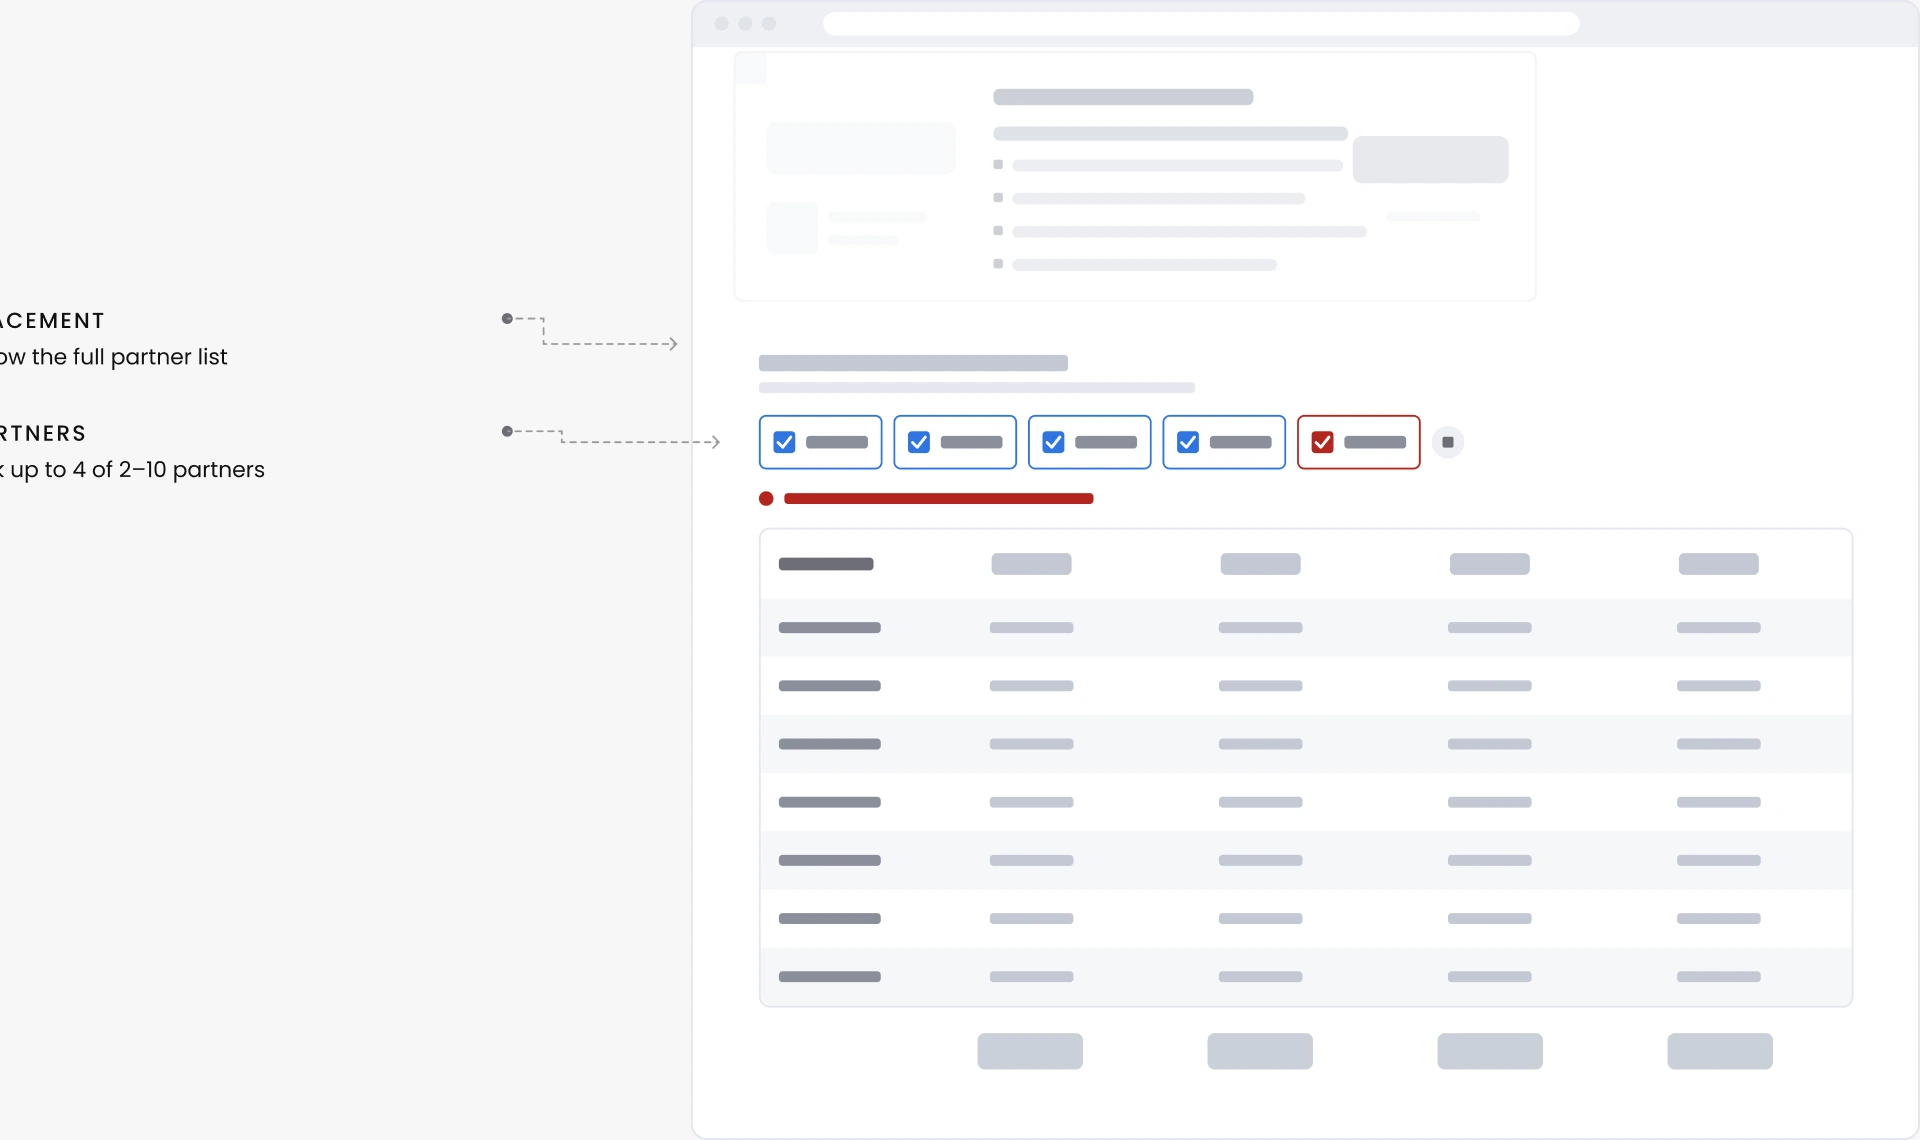

Try it · Pick partners to compare
Lost
✕ Lost on desktop. Likely why: it sat below the list, where few visitors scroll, and asked visitors to pick partners before showing any value.
Visual tabs
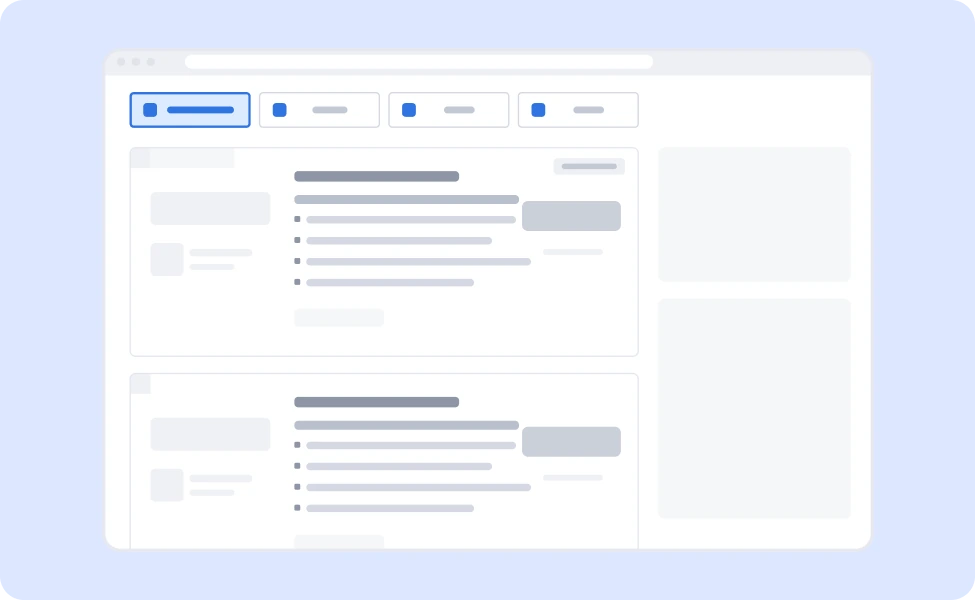
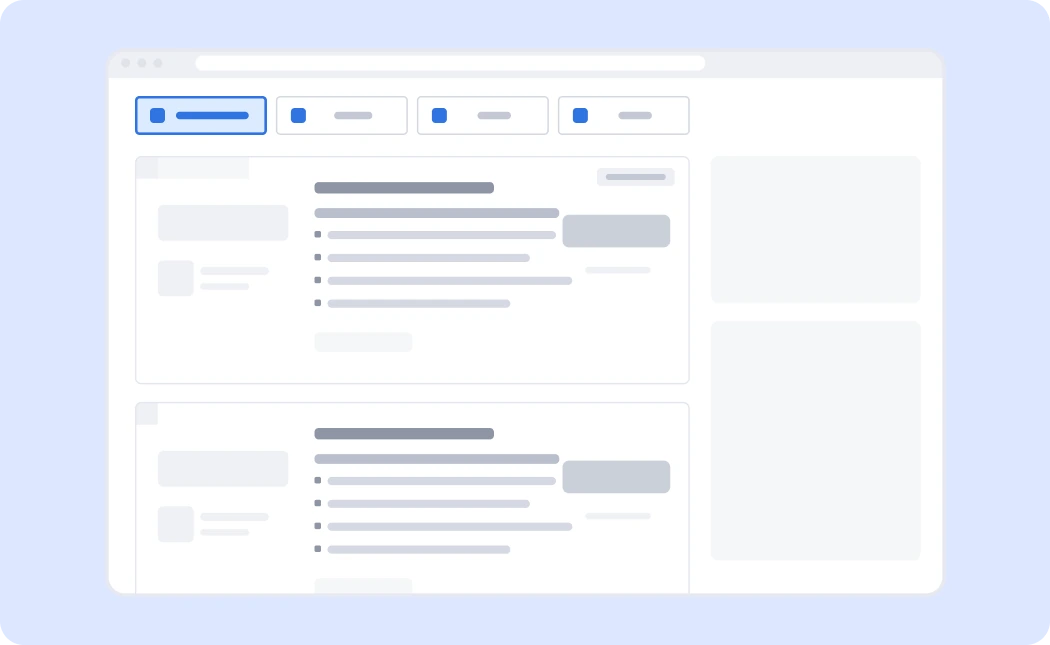
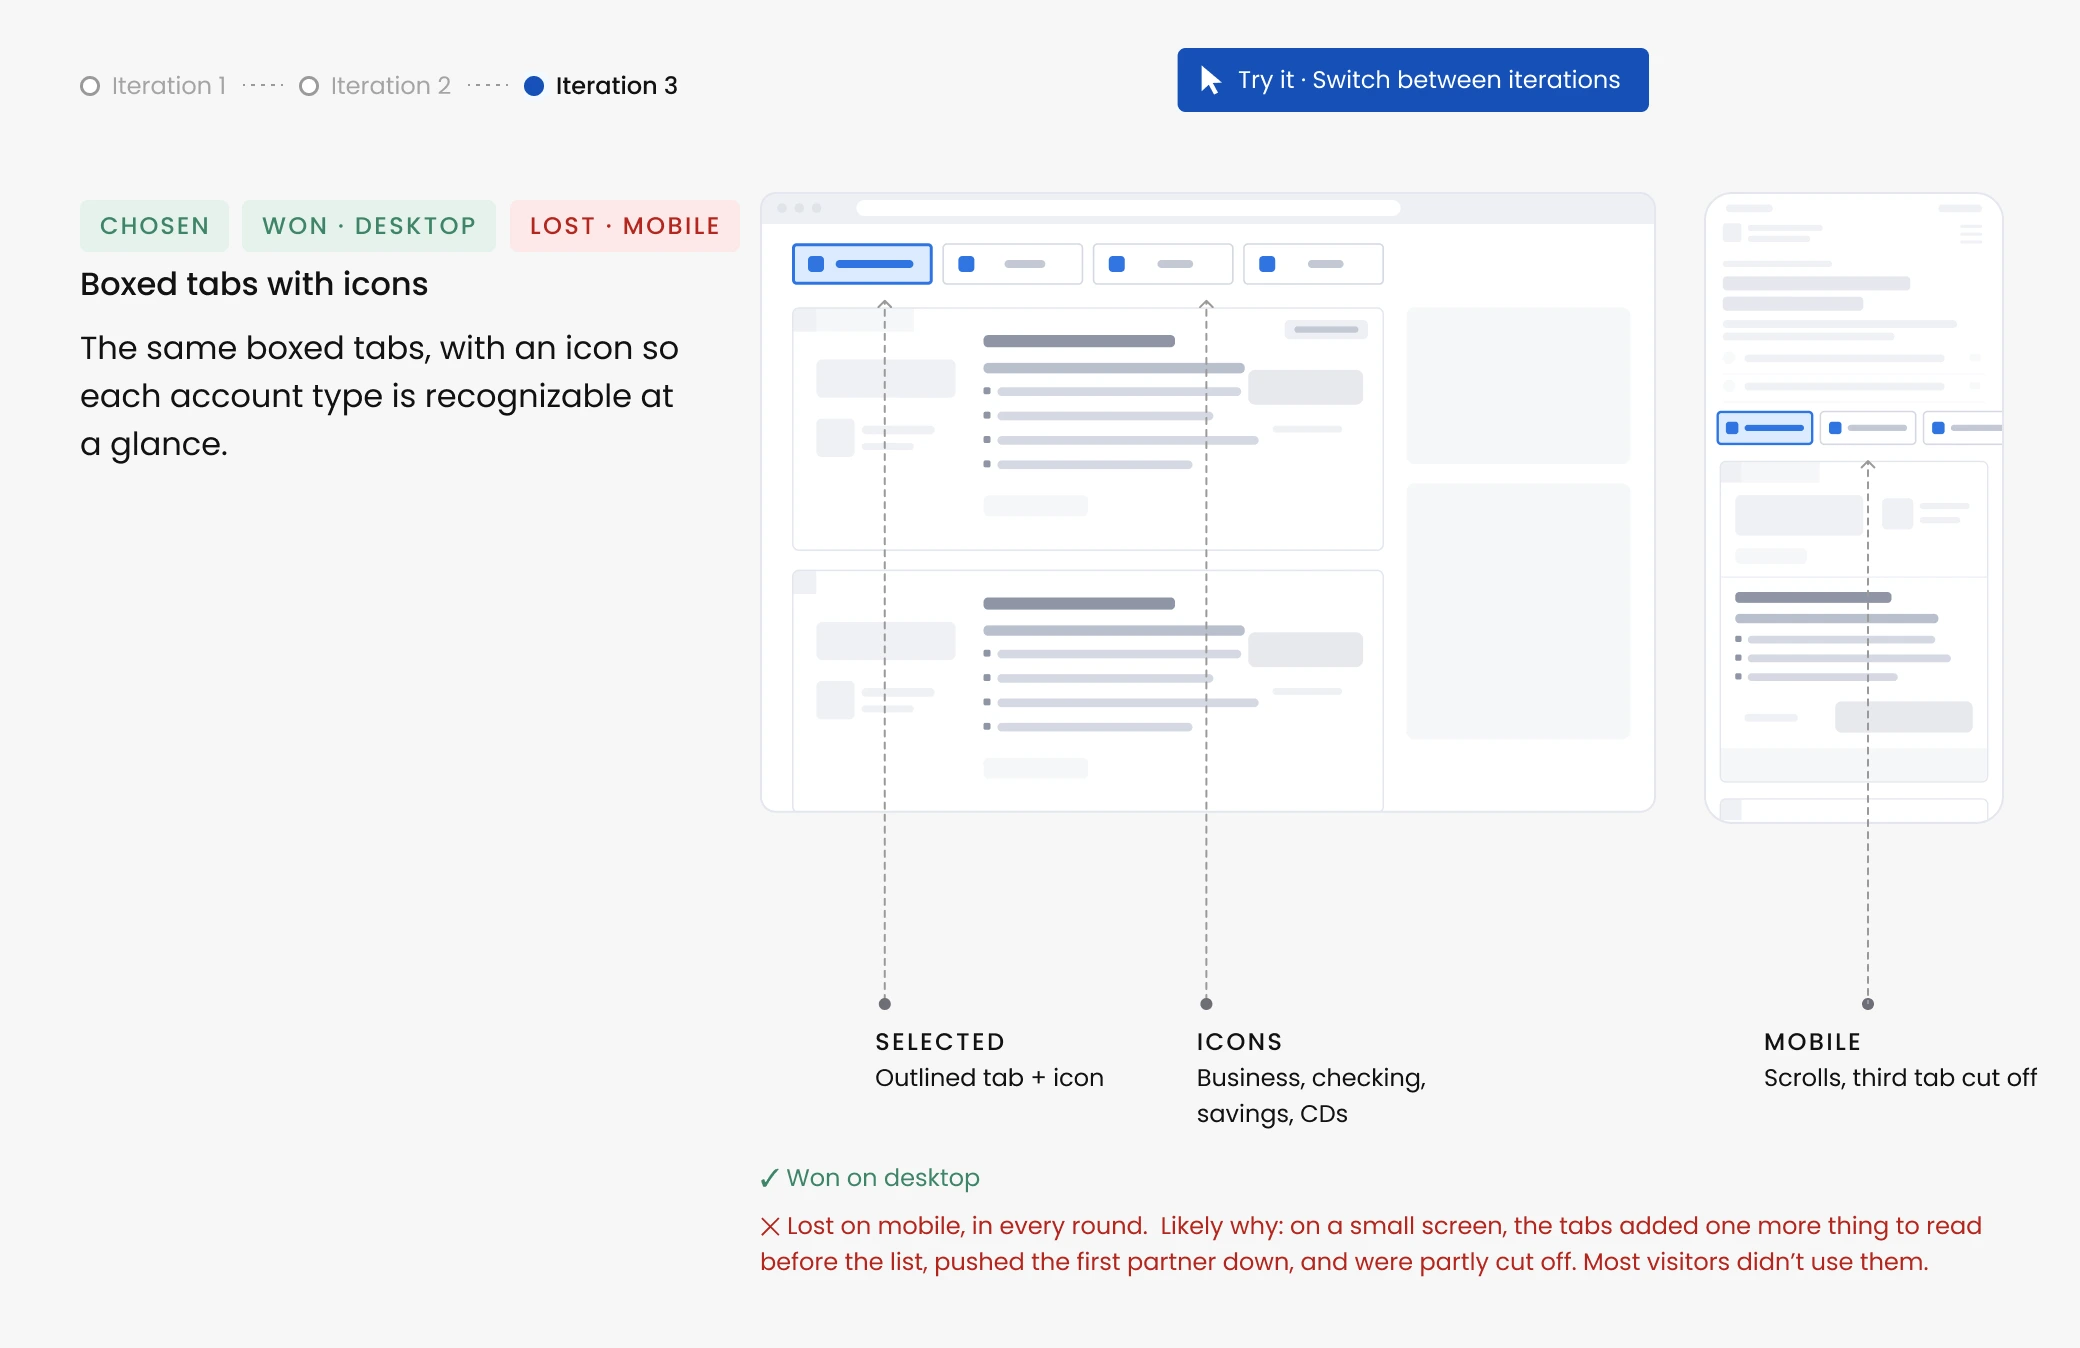
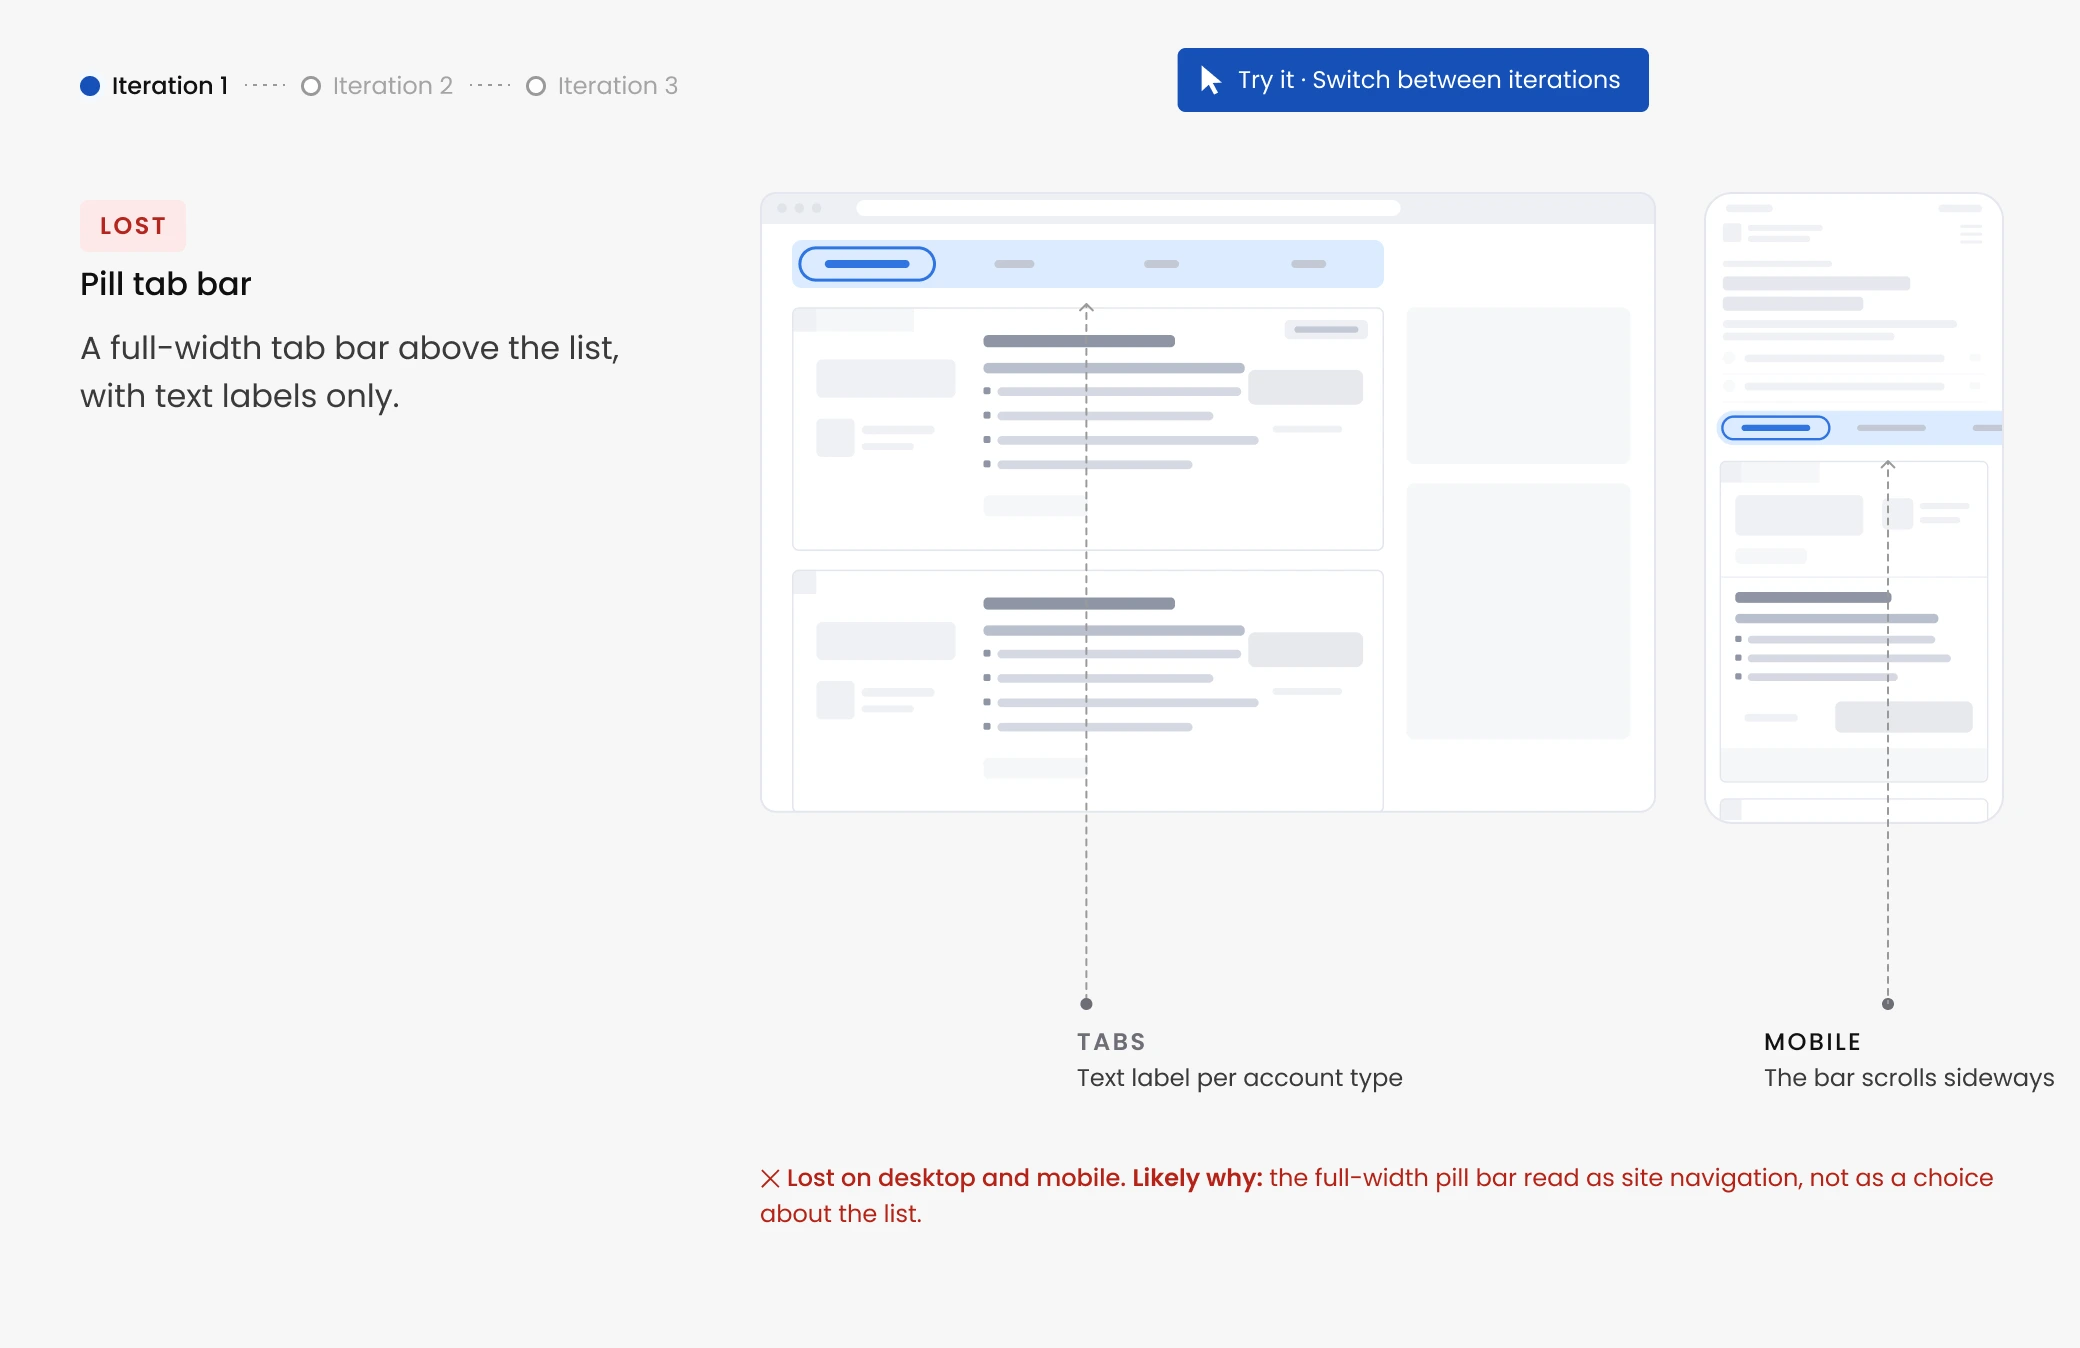
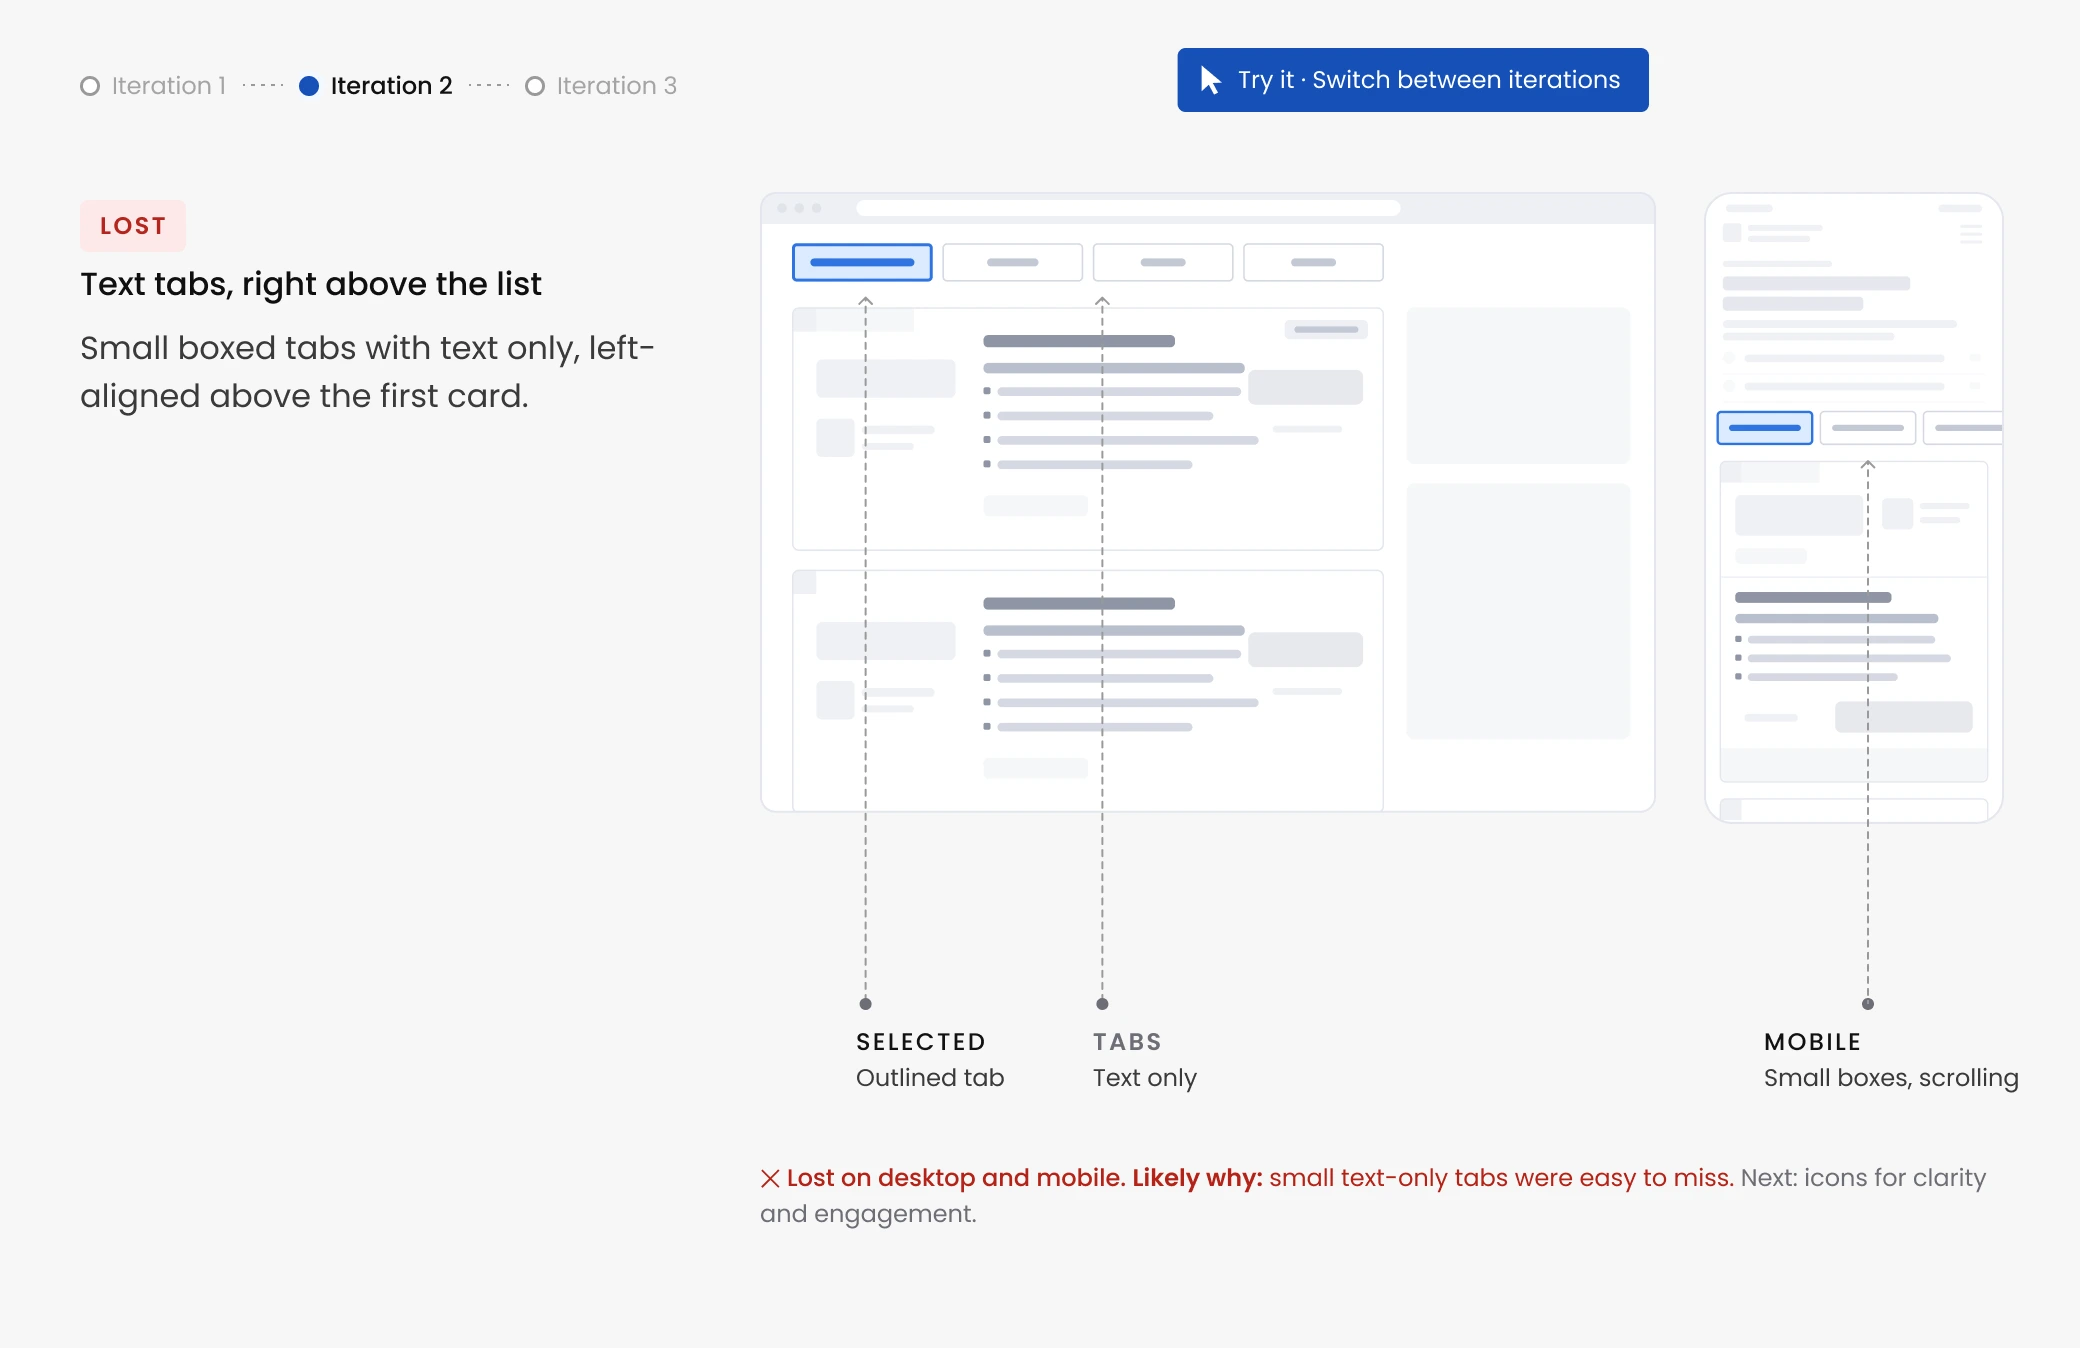
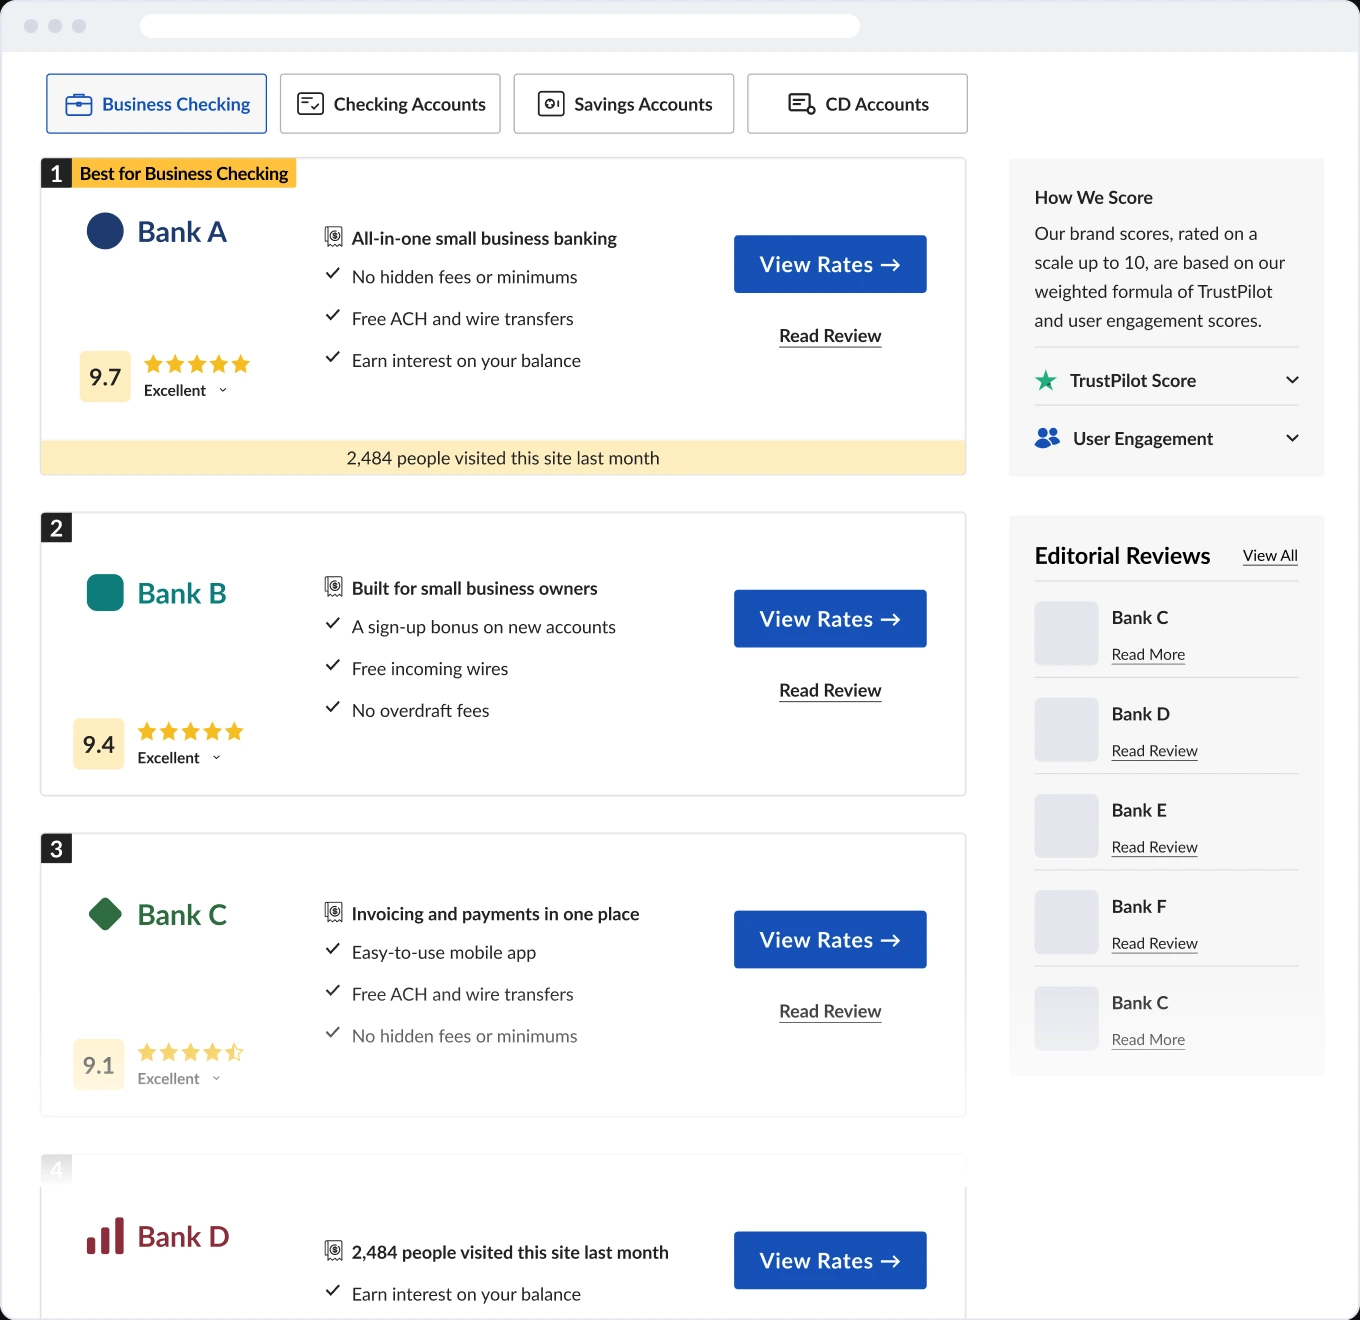
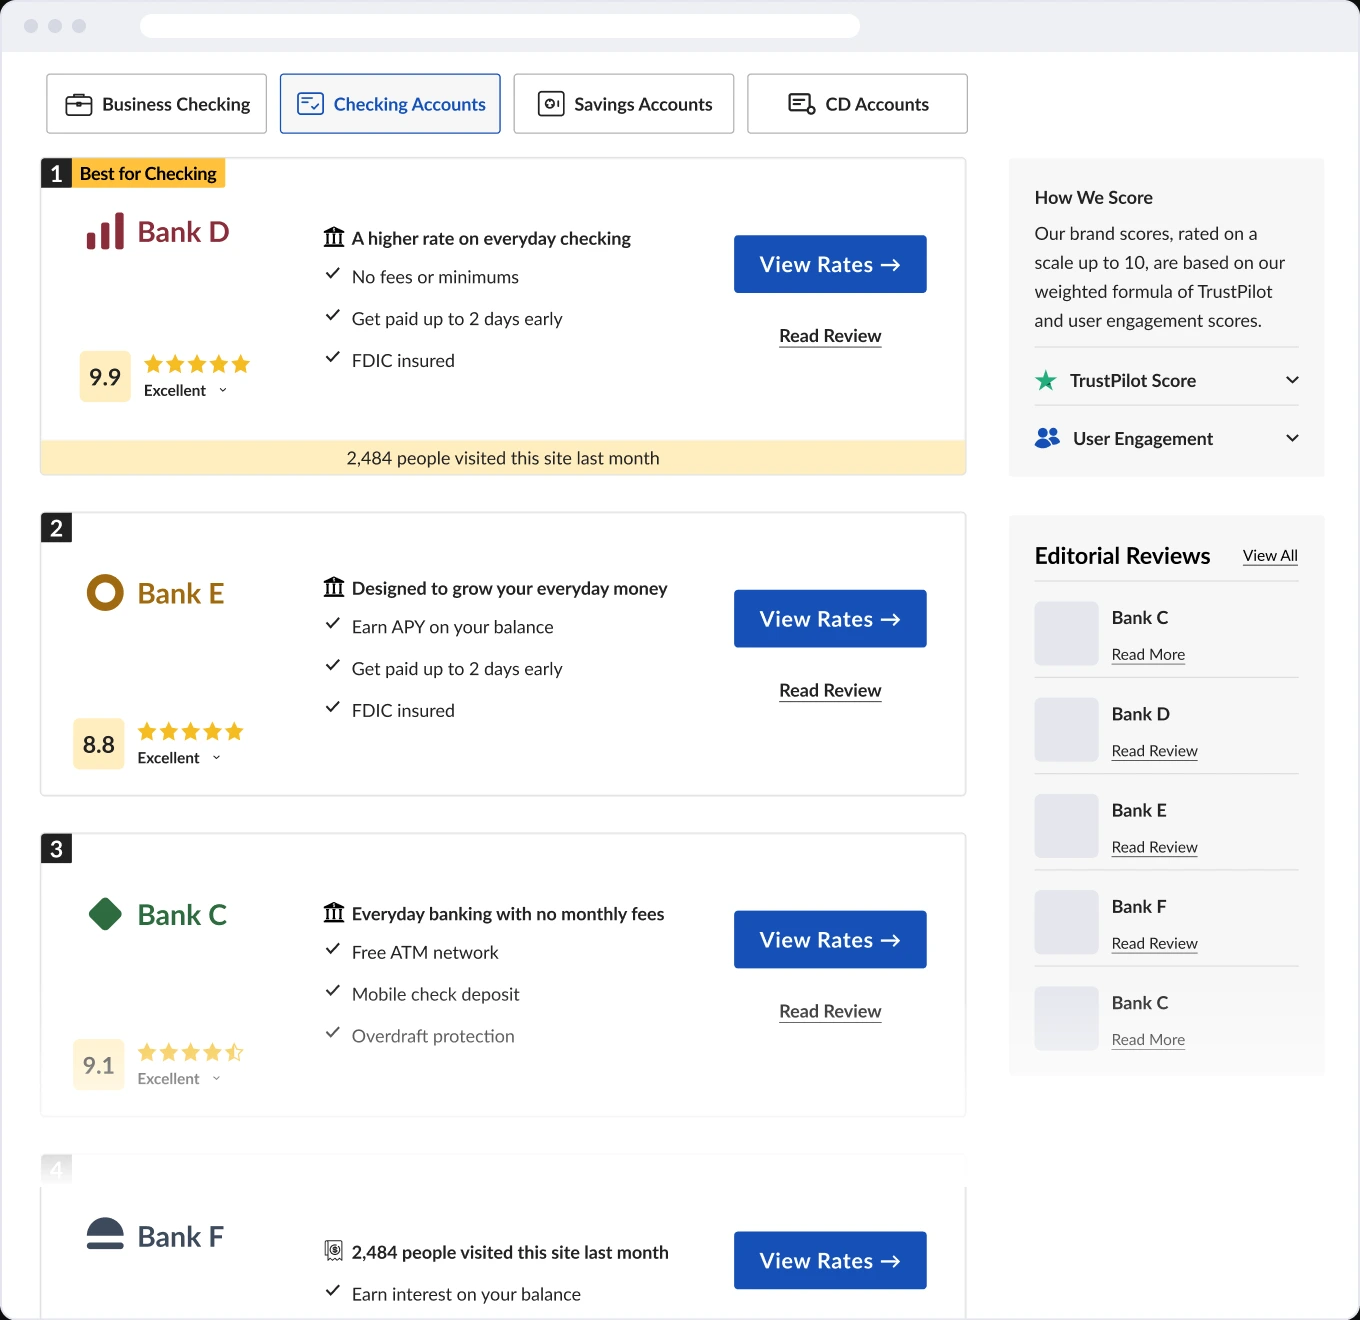
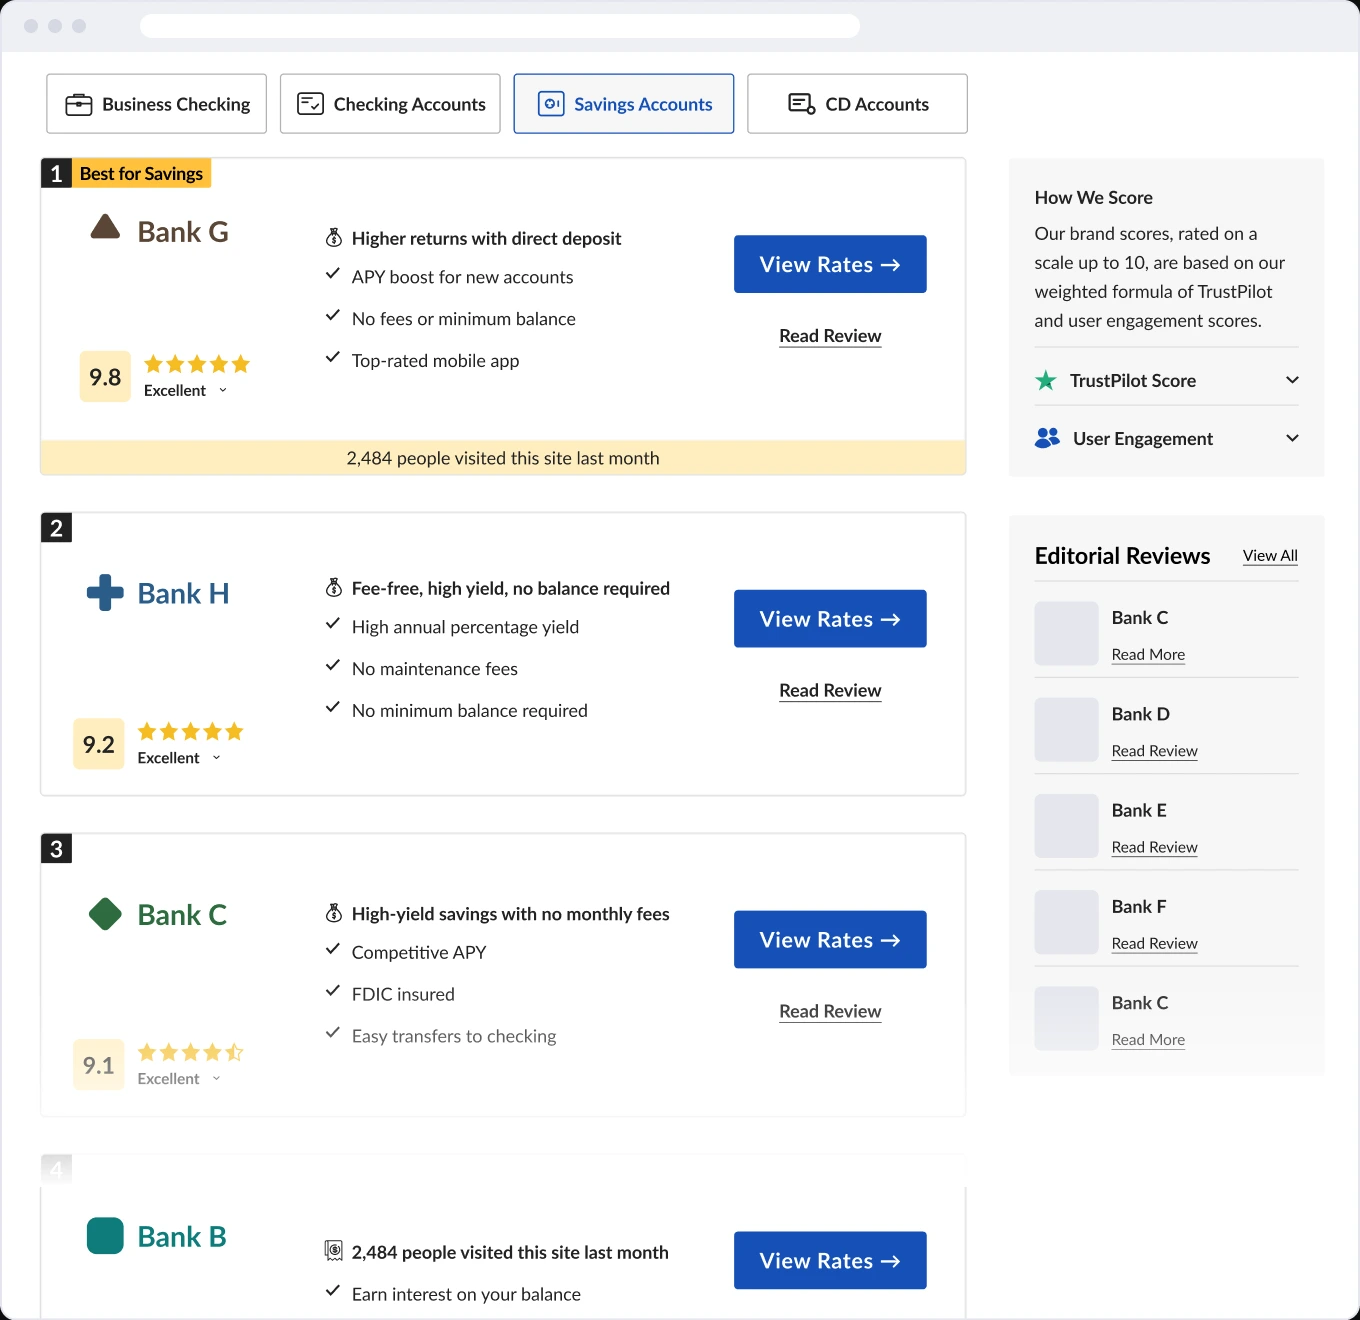
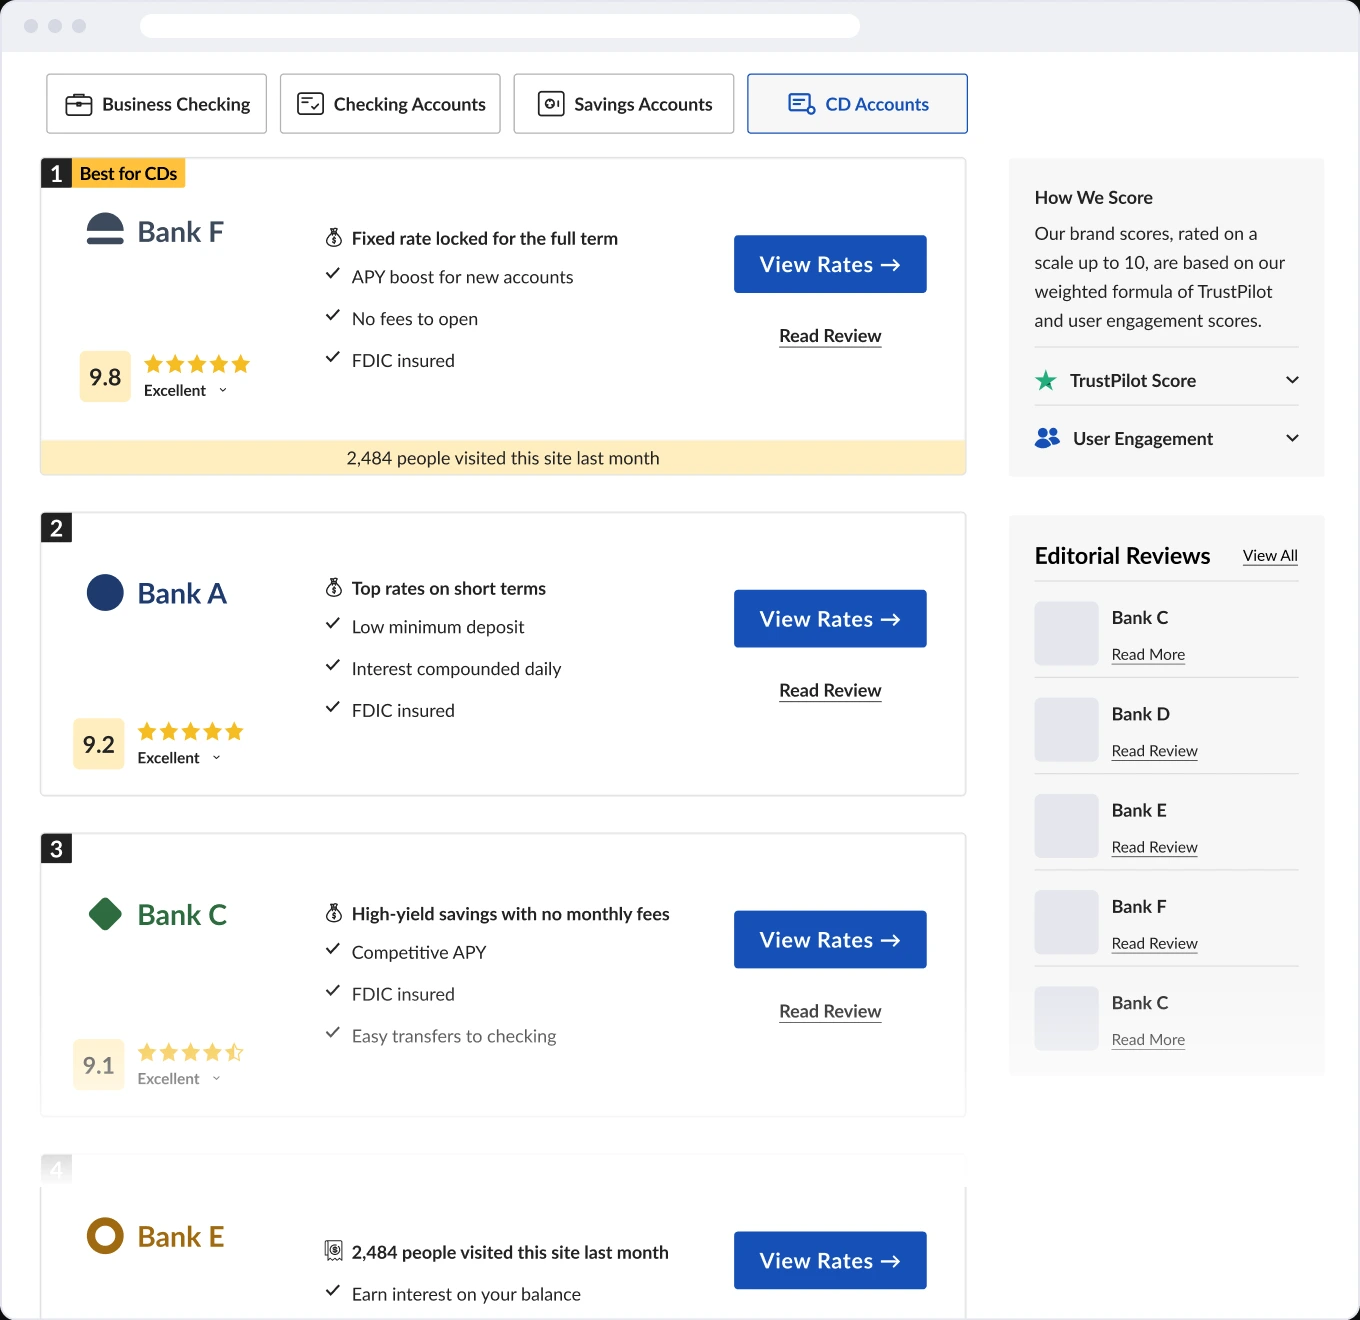
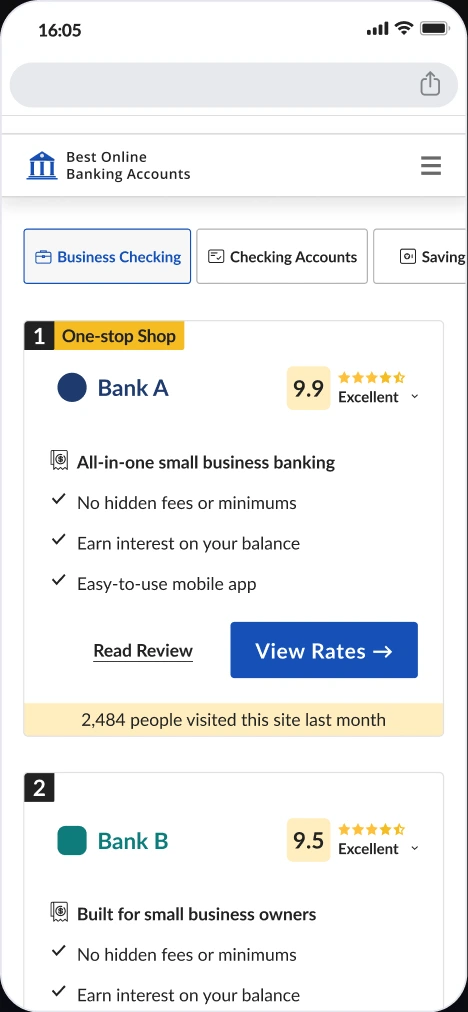
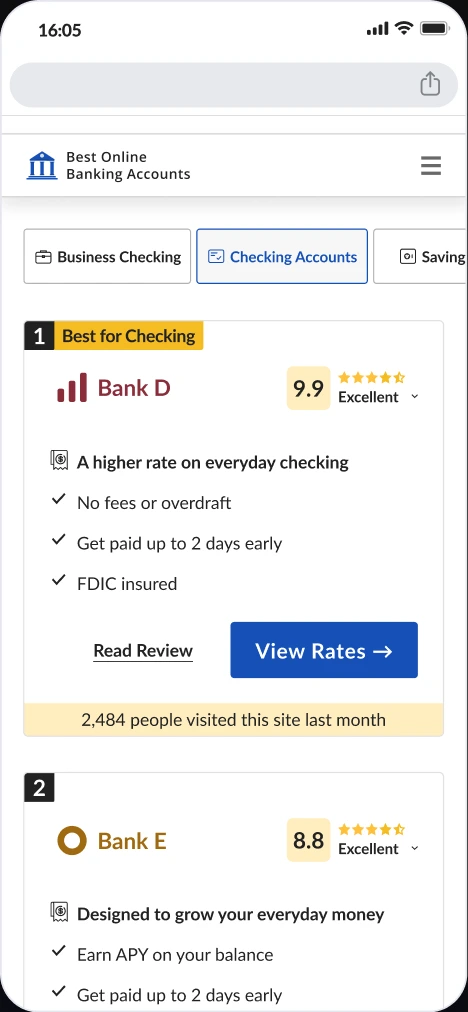
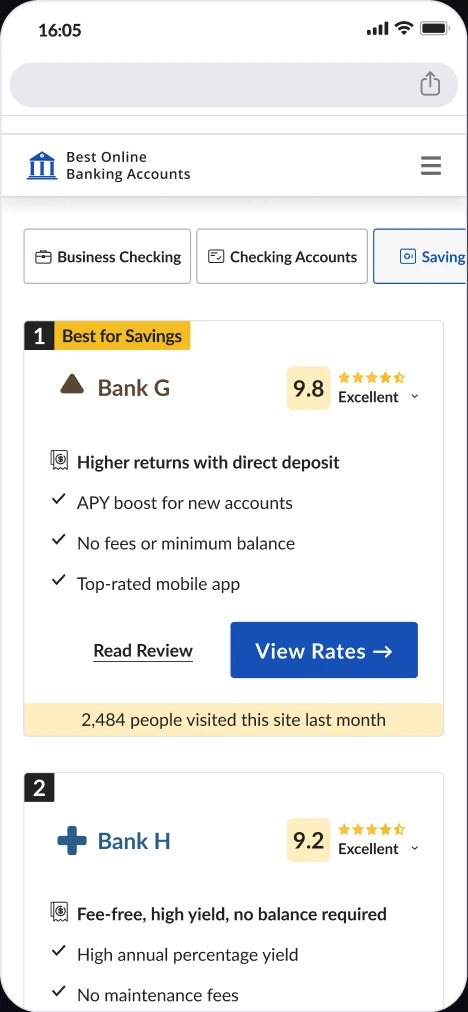
Tabs above the list take visitors straight to their account type. It took three iterations.
Decision
Tabs above the list, one per account type, with an icon on each. Separate pages would split traffic and SEO, a dropdown hides the options, and a quiz adds a step.
Trade-off
One more element above the first card.
Final design
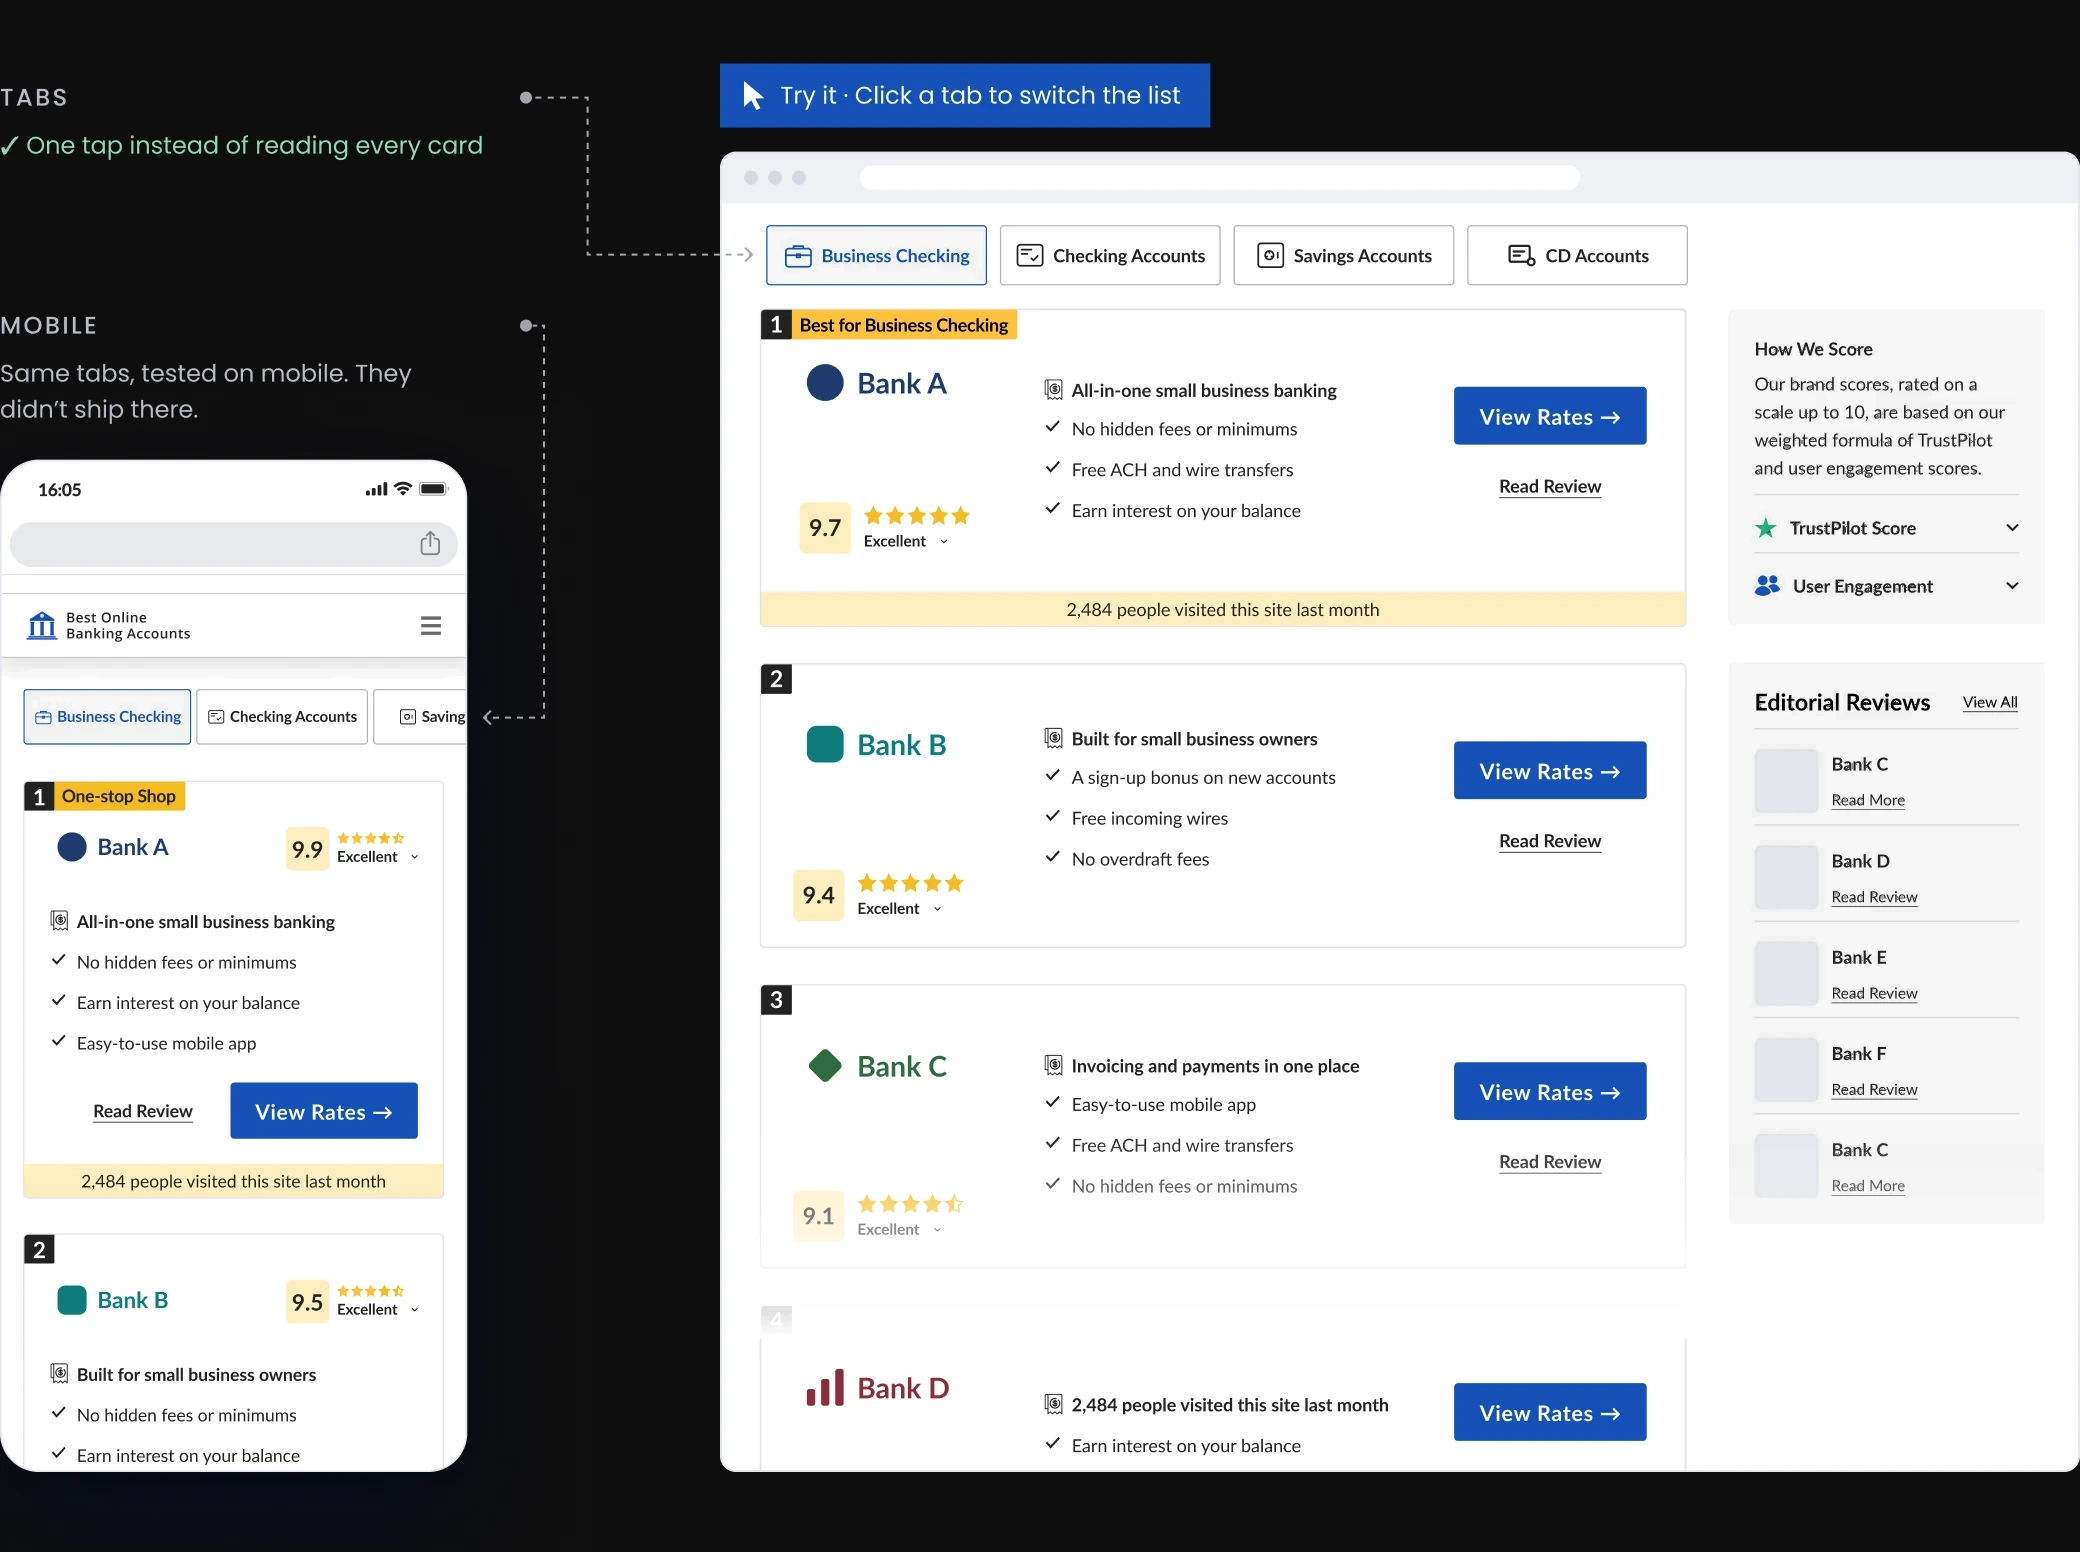
The chosen tabs, live on desktop. One tap filters the whole list to the accounts that fit that need. Partners keep their full cards; visitors see the relevant ones first.
Outcome
Visual tabs shipped on desktop.
+7.5%
Revenue per visitor on desktop, plus +8% conversion rate and +6% revenue per click. Tested on one traffic source first, then rolled out to both paid and organic.
2 verticals
One reusable component, defined with the developer. Live in Online Banking and Online Degrees. Also tested on Web Hosting, where it didn’t win.
What I learned
Bigger brands, different results
Patterns that worked for bigger competitors didn’t always work on our pages, so each one needed its own test.
Next for mobile
I’d test a lighter layout above the fold: fewer elements before the first card, so more partners show on the first screen with less detail each.
What I’d do differently
Next time I’d test a clickable prototype of the comparison tool before building it. It took the most effort, and it lost.
Let’s talk.
Open to senior product design roles. Based in Tel Aviv, working in English, Hebrew and Spanish.
Helping Visitors Decide: Tabs vs. Comparison
Project details
COMPANY
Cappsool
TIMEFRAME
3 weeks · Dec 2025
ROLE
Senior Product Designer
TEAM
PM, designer, dev
Visitors land on a page ranking online banking accounts, looking for the right account, fast. I researched and designed two ways to lift revenue per visitor, a comparison tool and visual tabs; the PM A/B tested each on its own.
Result: Won on desktop on revenue per visitor (+7.5%), conversion rate and revenue per click. Live in Online Banking and Online Degrees.
The problem
Visitors (B2C) wanted a fast answer. Partners (B2B) wanted their product features visible, and every card had to carry legal information.
Problem
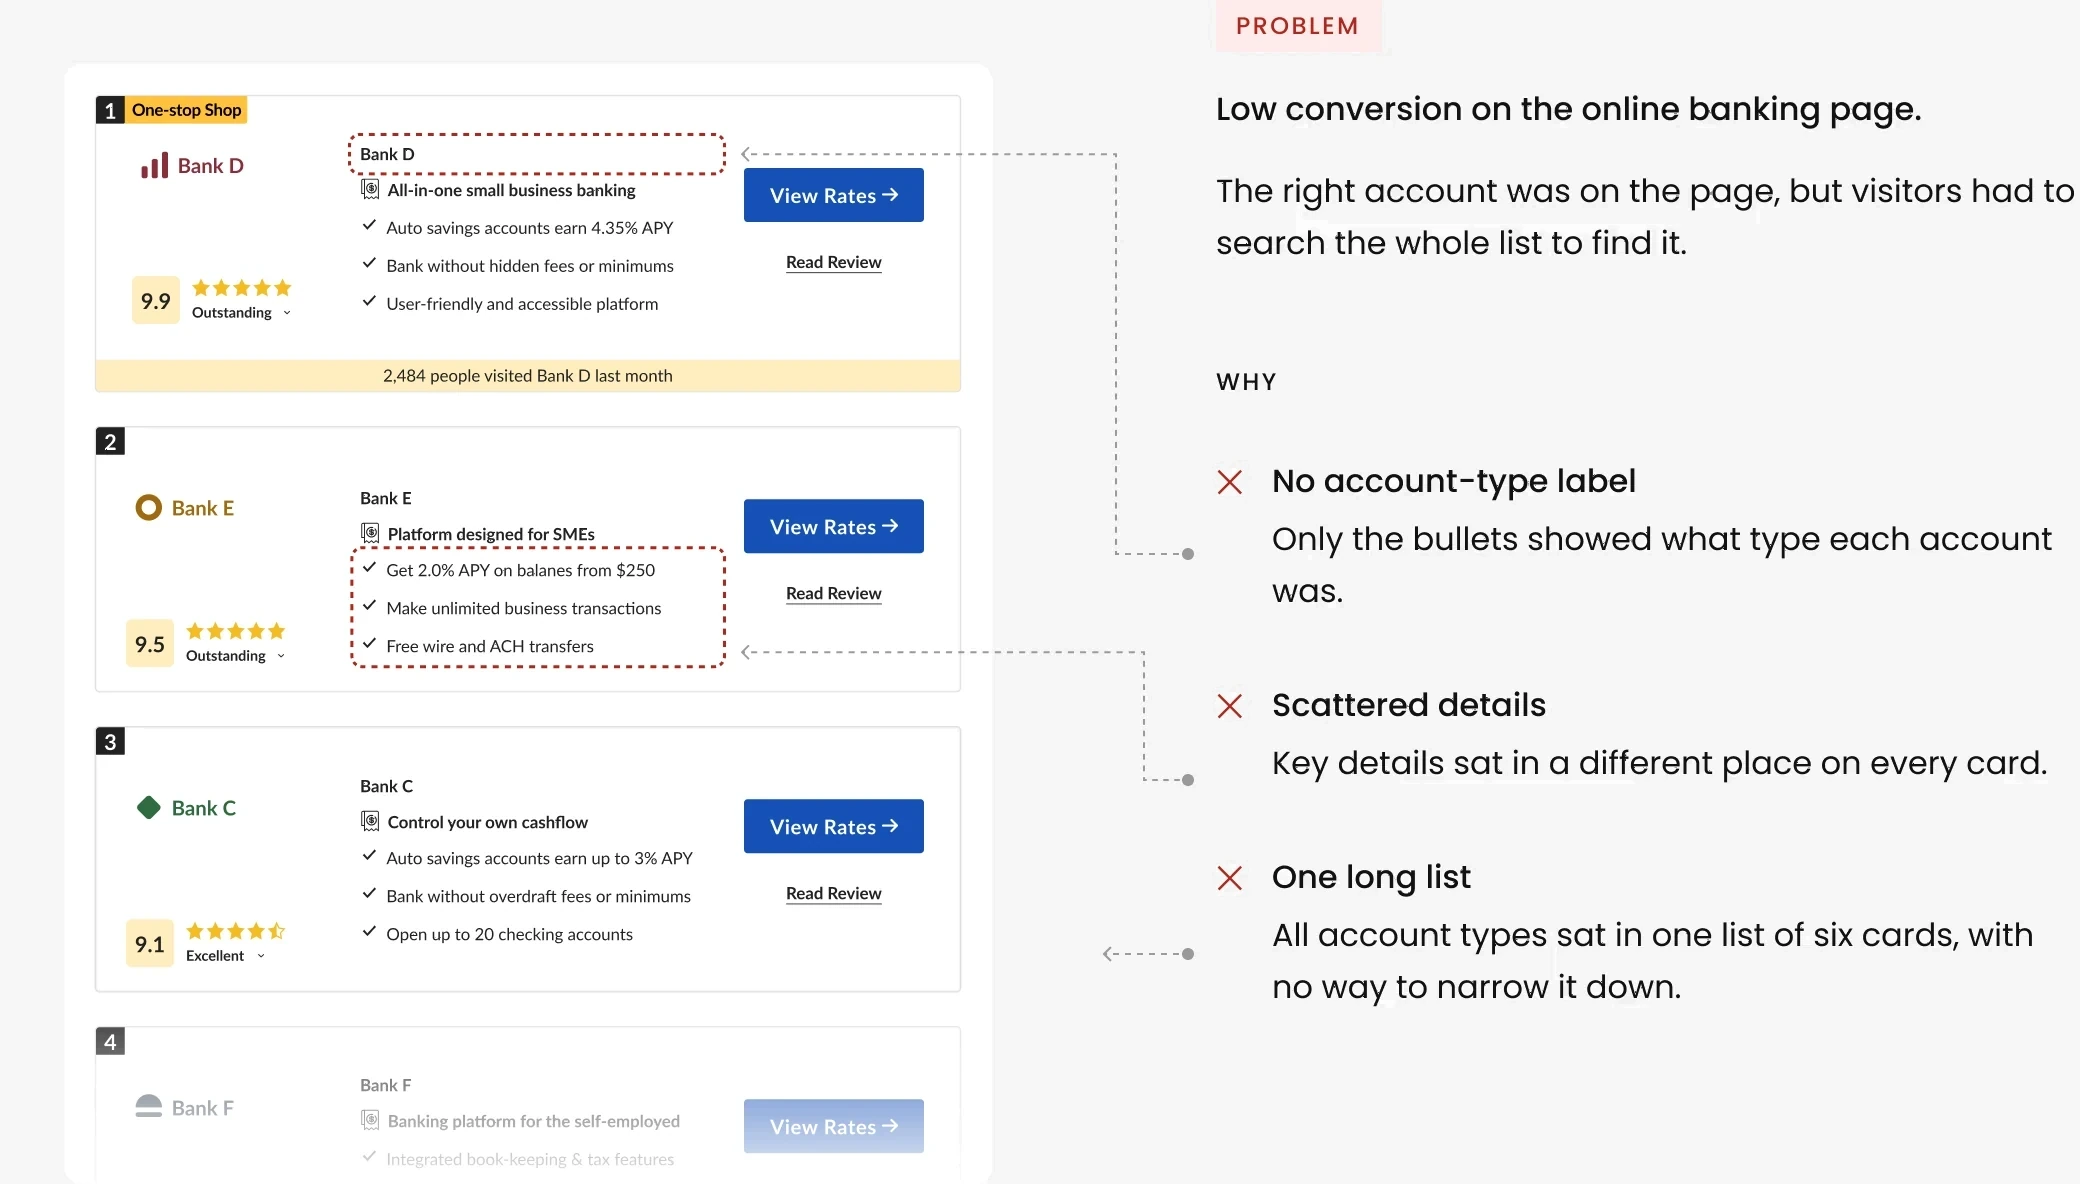
Low conversion on the online banking page.
The right account was on the page, but visitors had to search the whole list to find it.
WHY

✕
No account-type label
Only the bullets showed what type each account was.
✕
Scattered details
Key details sat in a different place on every card.
✕
One card above the fold
On mobile, only one card showed on the first screen.
Goal
Get visitors to the right partner, faster.
Research
What visitors told us, and what leading comparison sites do.
User testing
Interviews and session recordings with US participants.
What a visitor said
“I see a lot of providers and I’m not sure which one I need. It’s clear, but it’s taking me a while to find what I’m looking for. Not sure I would purchase.”
US participant · Recorded session

What we found
It wasn’t only banking: we saw the same pattern in several industries where conversion was dropping.
Benchmark
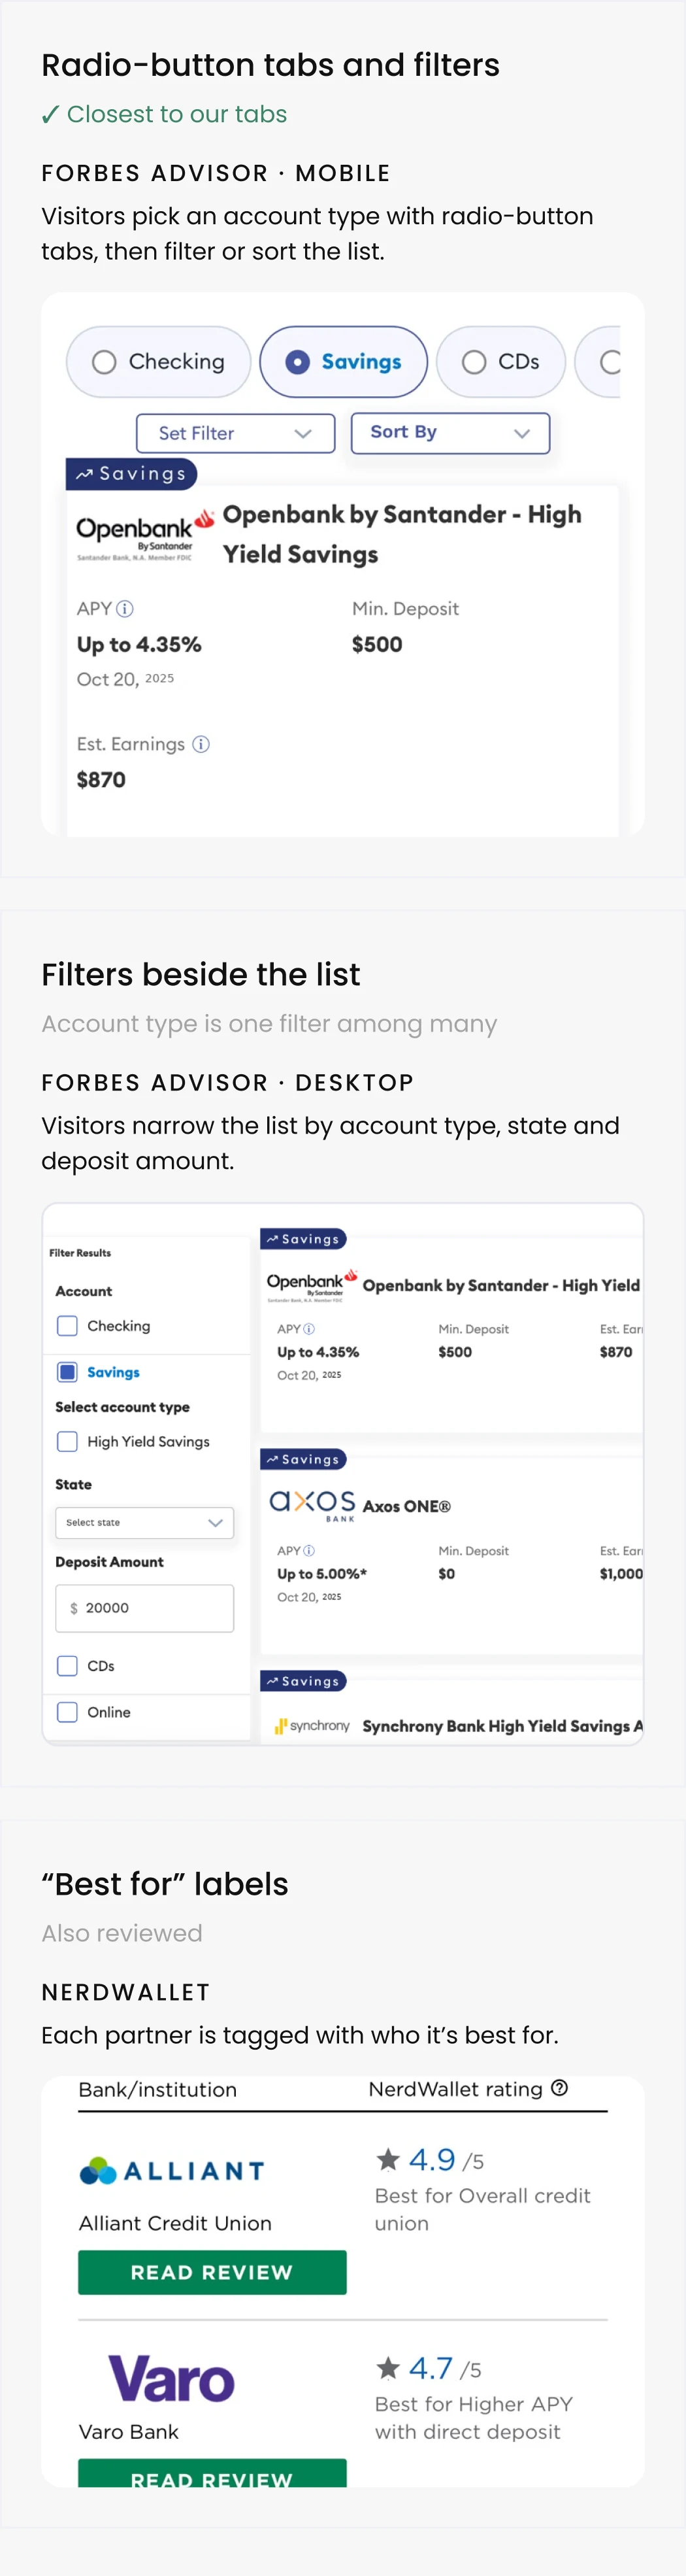
Most useful for us: Forbes’ radio-button tabs, where visitors pick the account type before the list. That was the direction we wanted for our tabs.
Benchmark examples
The approach
Two solutions to the same problem: one adds a step for in-depth comparison, the other narrows the list in one tap.
Complex pattern
Comparison tool
Simple pattern
Visual tabs

Interactions a visitor needs before reaching a partner.
4
comparison tool
1
visual tabs
OPTION A
Comparison tool
Stakeholders and partners wanted more visibility for product features, so visitors could compare up to four partners feature by feature.
Lost
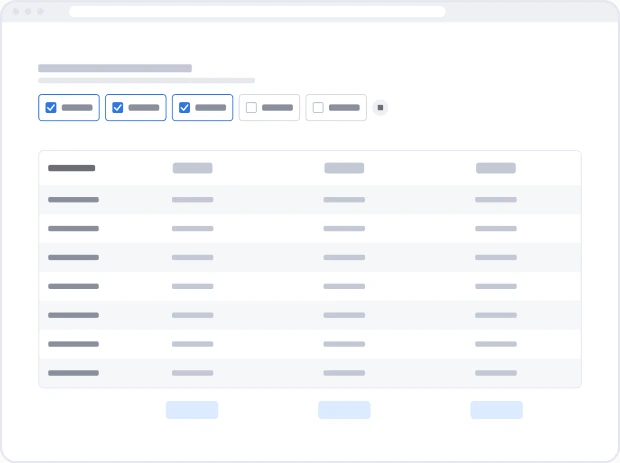
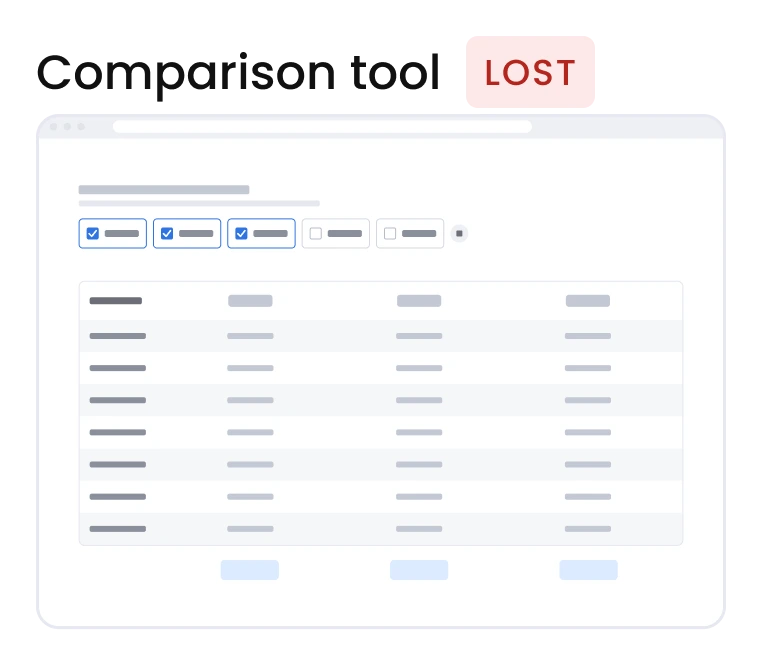
✕ Lost on desktop. Likely why: it sat below the list, where few visitors scroll, and asked visitors to pick partners before showing any value.
OPTION B
Visual tabs
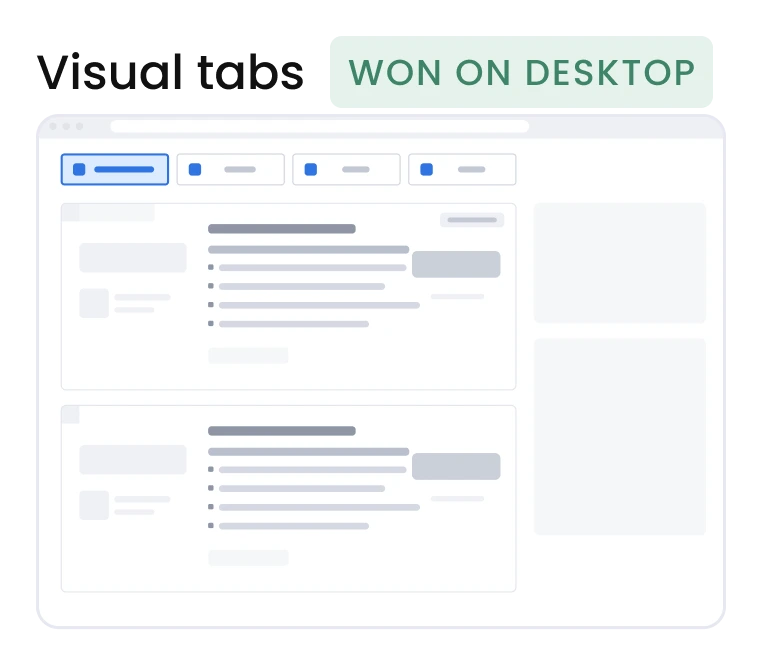
Tabs above the list take visitors straight to their account type. It took three iterations.
Iteration 3
CHOSEN
Boxed tabs with icons
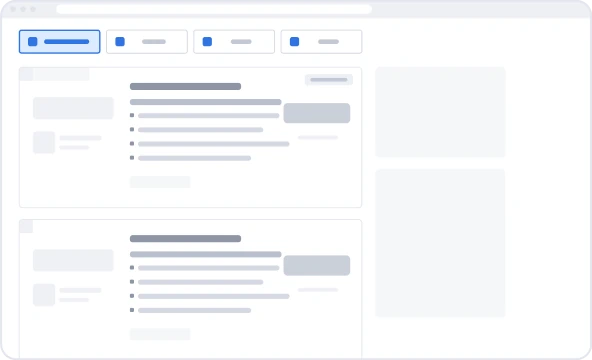
✓ Won on desktop
✕ Lost on mobile, in every round. Likely why: on a small screen, the tabs added one more thing to read before the list, pushed the first partner down, and were partly cut off. Most visitors didn’t use them.
Iteration 1
Lost
Pill tab bar
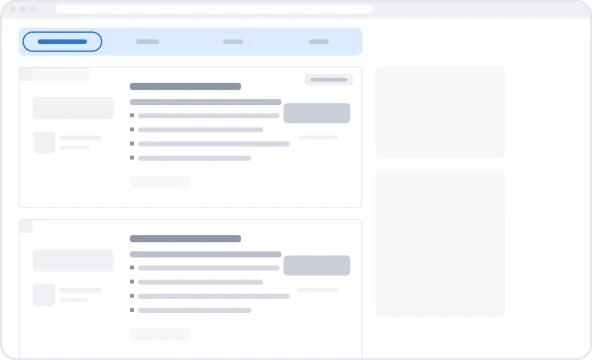
✕ Lost on desktop and mobile. Likely why: the full-width pill bar read as site navigation, not as a choice about the list.
Iteration 2
Lost
Text tabs, right above the list
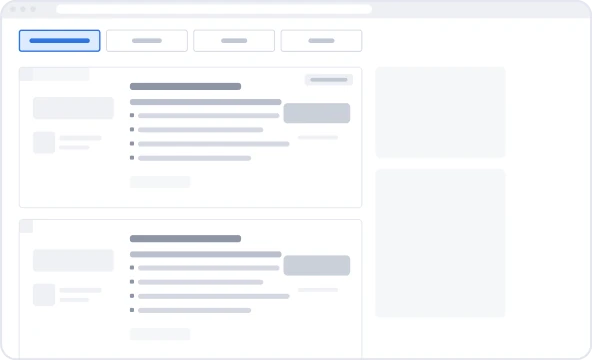
✕ Lost on desktop and mobile. Likely why: small text-only tabs were easy to miss.
Decision
Tabs above the list, one per account type, with an icon on each. Separate pages would split traffic and SEO, a dropdown hides the options, and a quiz adds a step.
Trade-off
One more element above the first card.
Final design
The chosen tabs, live on desktop. One tap filters the whole list to the accounts that fit that need. Partners keep their full cards; visitors see the relevant ones first.
Tabs
✓ One tap instead of reading every card
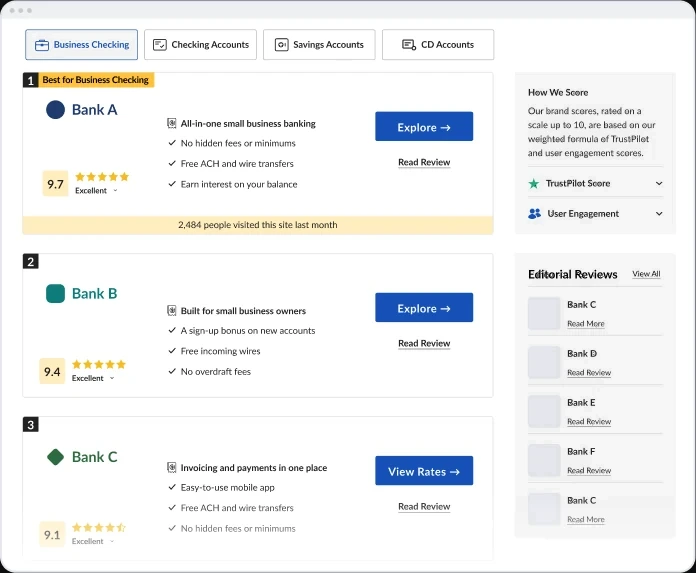
Mobile: tested, didn’t ship. The existing list stayed.
Outcome
Visual tabs shipped on desktop.
+7.5%
Revenue per visitor on desktop, plus +8% conversion rate and +6% revenue per click. Tested on one traffic source first, then rolled out to both paid and organic.
2 verticals
One reusable component, defined with the developer. Live in Online Banking and Online Degrees. Also tested on Web Hosting, where it didn’t win.
What I learned
Bigger brands, different results
Patterns that worked for bigger competitors didn’t always work on our pages, so each one needed its own test.
What I’d do differently
Next time I’d test a clickable prototype of the comparison tool before building it. It took the most effort, and it lost.
Let’s talk.
Open to senior product design roles. Based in Tel Aviv, working in English, Hebrew and Spanish.